Sell stocks in May and go on vacation? Not this year
This is a stark contrast to historical data, which show that the period from May to October has usually been much weaker for stocks than the months from November to April. For the five indices studied, the average monthly return in the weaker half-year was only 0.25%, while in the better period it rose to 1.18%. The conclusion is therefore simple: the saying still makes sense as an important observation, but it cannot replace analysis of what is really happening in the market.
Unthinking application of the "Sell in May and go away" rule this year could prove to be a costly mistake. The equity market does not behave as the seasonality alone would suggest. Instead of a summer slowdown we see a return of risk appetite, improved investor sentiment, and very good performance of the main indices. The reason is quite simple: the seasonal pattern has been covered by fundamentals. Companies are showing strong results, earnings forecasts are being revised upward, and investors are buying not only the current improvement but also the promise of growth in the coming quarters.
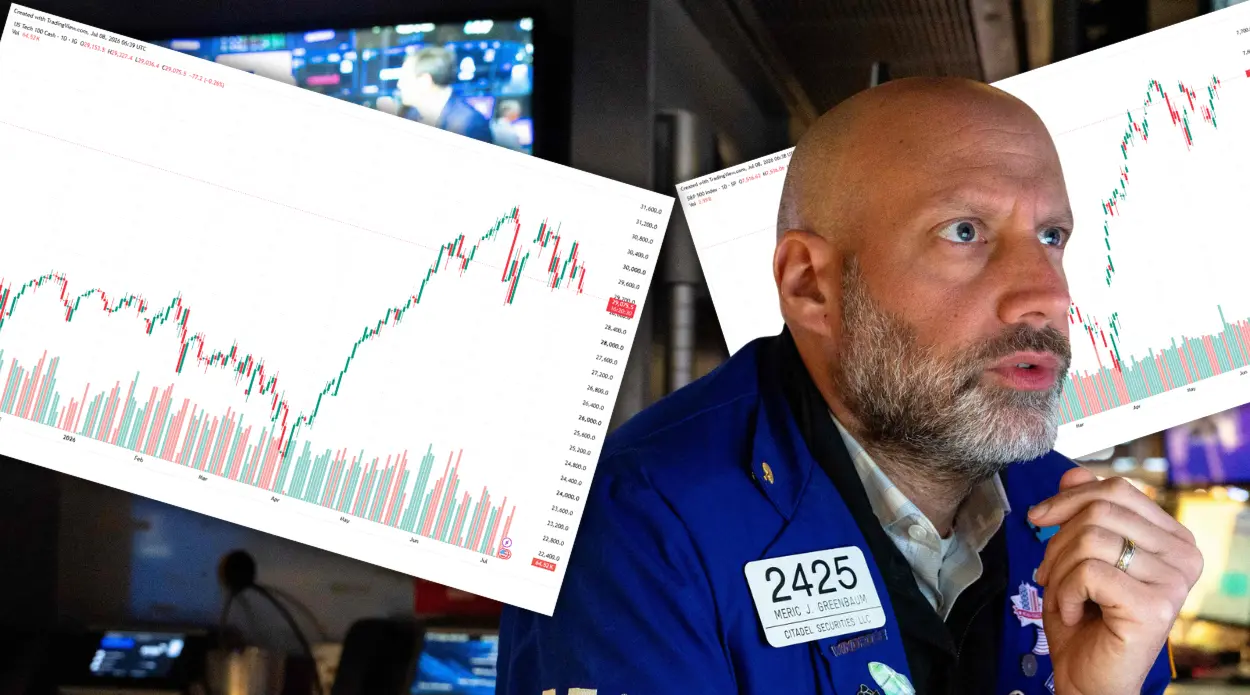
U.S. S&P 500 records 8 weeks of gains
The U.S. S&P 500 has had eight consecutive weeks of gains, the longest such streak since December 2023. This is an important signal, as it appears in an environment that is far from risk-free. The war with Iran has again raised concerns about inflation and fuel prices, and U.S. 10‑year Treasury yields are approaching 4.6%. A stronger signal comes from the 30‑year bond market, whose yields have reached levels last seen in 2007.
At first glance this looks contradictory. Stocks price future economic growth and corporate earnings, while bonds indicate that the cost of capital may remain structurally higher than in previous years.
This contradiction is today one of the most important topics for investors. Expensive money does not stop the equity market, because behind the scenes a very strong narrative about technology development, artificial intelligence, and increasing investment spending is operating. Such development requires capital, and capital is today more expensive than a few years ago. The key question remains: how long can corporate profits balance a high‑interest‑rate and high‑bond‑yield environment?
For now the answer coming from corporate results is positive for the market. After the release of reports, 94% of S&P 500 companies showed results better than expected, and 84% of them did so. On average, earnings for Q1 2026 were 29% higher than a year earlier, while revenues rose 11%. This is a very important difference. It shows that companies are not only selling more, but above all effectively protecting margins. In conditions of more expensive financing and greater cost pressure, this information is even more important to investors than the sales dynamics themselves.
"Sell in May" not this time
This year’s May is therefore a good reminder that "Sell in May" is not an investment strategy, but a suggestion based on statistical observations. The historical pattern can help in thinking about the market, but it should not replace analysis of earnings, liquidity, and sentiment. That does not mean the famous saying has lost its relevance.
On the contrary, its strength comes from the fact that for many decades it described real market seasonality. Historical data show that on global exchanges the period from May to October was clearly weaker than the six months from November to April. For all five markets studied, the average monthly return from November to April was 1.18%, while from May to October it fell to just 0.25%, and three months in that weaker half-year produced average losses.
The seasonality is backed by concrete mechanisms. In the first quarter companies often publish full‑year forecasts, which can support stock prices. In the fourth quarter many investors rebuild portfolios with the next year in mind and the well‑known January effect. Summer months are usually poorer in such positive impulses, and they are also characterized by lower investor activity.
In 2026 this historical scheme has, however, been covered by very concrete data. The S&P 500’s 3.7% rise since the beginning of May, the Nasdaq’s 5.8% gain, and the WIG’s 7.3% increase show that the market currently believes more in corporate results than in the calendar. Investors do not ignore risks related to inflation, fuel prices, bond yields, and expensive capital. They do, however, recognize that strong corporate results, artificial intelligence, and improved sentiment are more important today than old market adages.
Historical data:
|
Market / index
|
Average monthly return May–October
|
Average monthly return November–April
|
Difference
|
|
Poland WIG
|
0.30%
|
1.12%
|
0.82 percentage points
|
|
USA S&P 500
|
0.27%
|
1.05%
|
0.78 percentage points
|
|
USA Nasdaq Composite
|
0.68%
|
1.44%
|
0.76 percentage points
|
|
UK FTSE 100
|
-0.04%
|
1.09%
|
1.13 percentage points
|
|
Germany DAX
|
0.05%
|
1.22%
|
1.17 percentage points
|
|
Average for 5 indices
|
0.25%
|
1.18%
|
0.93 percentage points
|
Source: LSEG eToro
Historical results do not guarantee future returns. The study was prepared based on historical index price data up to the end of 2022. The data range covers WIG from 1999, S&P 500 from 1964, Nasdaq Composite from 1980, FTSE 100 from 1984, and DAX from 1965. For each index, average monthly returns were compared for the periods from May to October and from November to April.