


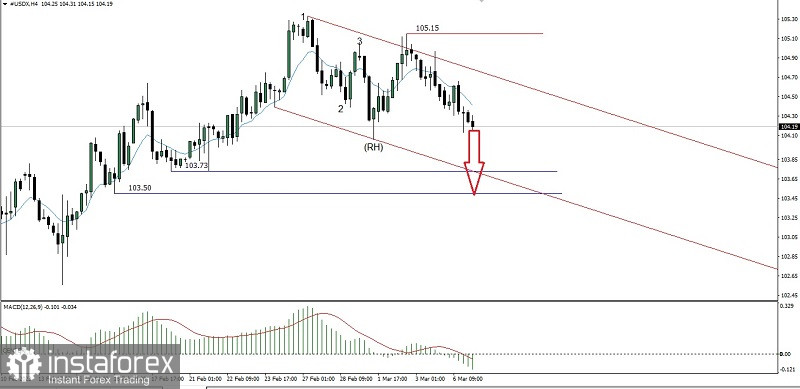
There is a few interesting things on the USDX 4 hour chart :
1. Bearish 123 pattern followed by the appearance of Ross Hook (RH).
2. Move inside the downside channel.
3. Move under the EMA 10.
From those three things abobe seems like #USDX will continue the downside until if it manages to break below level 104,06. If this level successfully broken then #USDX has the potential to go downside up to the level 103,73 as the main target and the level 103,50 as the next target to be addressed as long as there is no upward correction passing through the level 104,97 because if this level successfully broken above then all the downward scenario that has been described before will cancel itself.
(Disclaimer)
Relevance up to 04:00 2023-03-08 UTC+1 This information is provided to retail and professional clients as part of marketing communication. It does not contain and should not be construed as containing investment advice or investment recommendation or an offer or solicitation to engage in any transaction or strategy in financial instruments. Past performance is not a guarantee or prediction of future performance. Instant Trading EU Ltd. makes no representation and assumes no liability as to the accuracy or completeness of the information provided, or any loss arising from any investment based on analysis, forecast or other information provided by an employee of the Company or otherwise. Full disclaimer is available here.


