










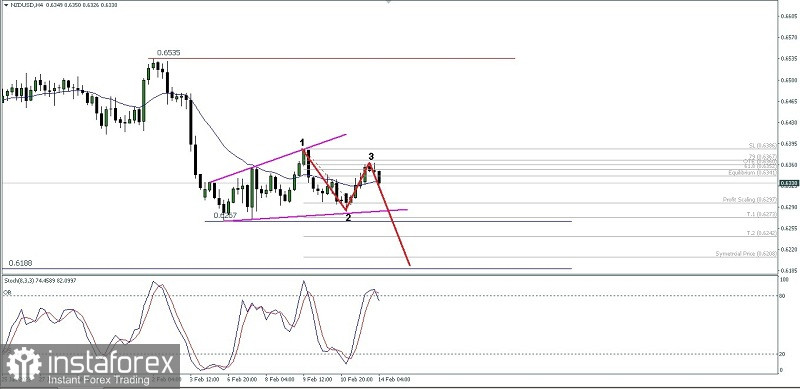
If we pay attention on its 4 hour chart NZD/USD commodity currency pairs, there is a few interesting facts:
1. The appearance of Ascending Broadening Wedge pattern,
2. Followed by the formation of Bearish 123 pattern.
3. Stochastic Oscillator indicator which trying to come back down from its Overbought level.
Based on those three facts above clearly seen if Kiwi in the nearest future has the potential to continue the downside where currently "Isolated Low" level which is point 2 at the level 0,6286 will try to break down by NZD/USD. If this level successfully broken down then the next level the to aim for is 0.6208 with a note that during the journey to these levels there is no significant upward correction movement to break above 0.6386 because if this level is breaks and exceeded then the downside scenario that has been described Previously it was canceled by itself.
Relevance up to 04:00 2023-02-15 UTC+1 This information is provided to retail and professional clients as part of marketing communication. It does not contain and should not be construed as containing investment advice or investment recommendation or an offer or solicitation to engage in any transaction or strategy in financial instruments. Past performance is not a guarantee or prediction of future performance. Instant Trading EU Ltd. makes no representation and assumes no liability as to the accuracy or completeness of the information provided, or any loss arising from any investment based on analysis, forecast or other information provided by an employee of the Company or otherwise. Full disclaimer is available here.