Technical analysis:
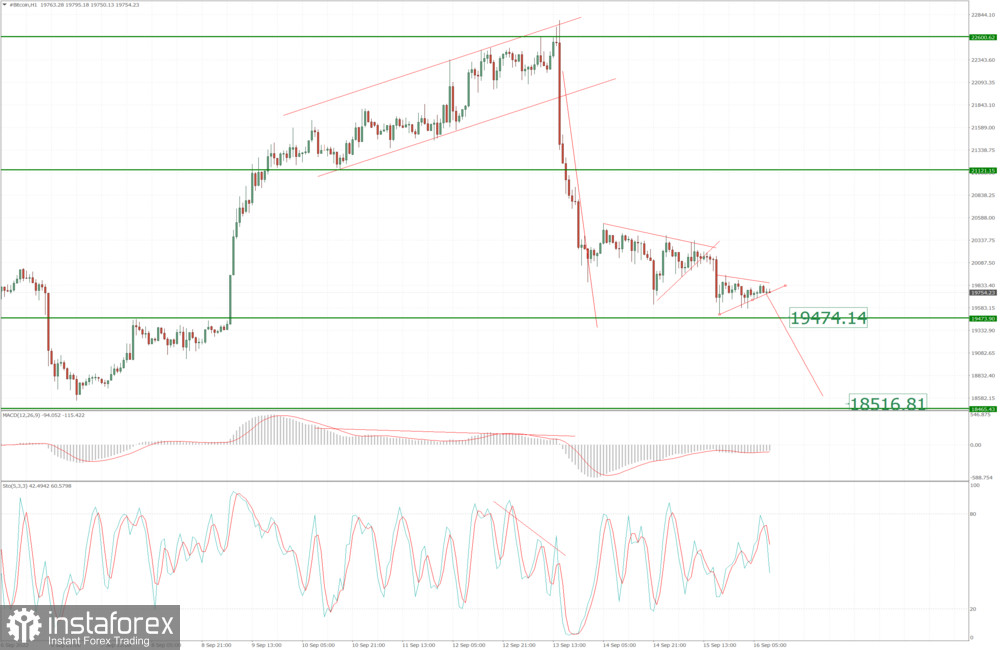
BTC has been trading sideways at the price of $19.755 but I see symmetrical triangle pattern in creation, which is sign for potential downside continuation.
Trading recommendation:
Due to the strong downside pressure in the background and symmetrical triangle pattern in creation, I see potential for further downside movement.
Watch for the selling opportunities in case of the breakout of the triangle pattern.
Downside objectives are set at the price of $19.475 and $18.500.
Stochastic oscillator is showing fresh downside cross from the overbought zone, which can be good sign for the further downside continuation.
Key resistance is set at the price of $20.400
Earn on cryptocurrency rate changes with InstaForex
Download MetaTrader 4 and open your first trade
Relevance up to 09:00 2022-09-17 UTC+2 Company does not offer investment advice and the analysis performed does not guarantee results. The market analysis posted here is meant to increase your awareness, but not to give instructions to make a trade.
Read more: https://www.instaforex.eu/forex_analysis/293074