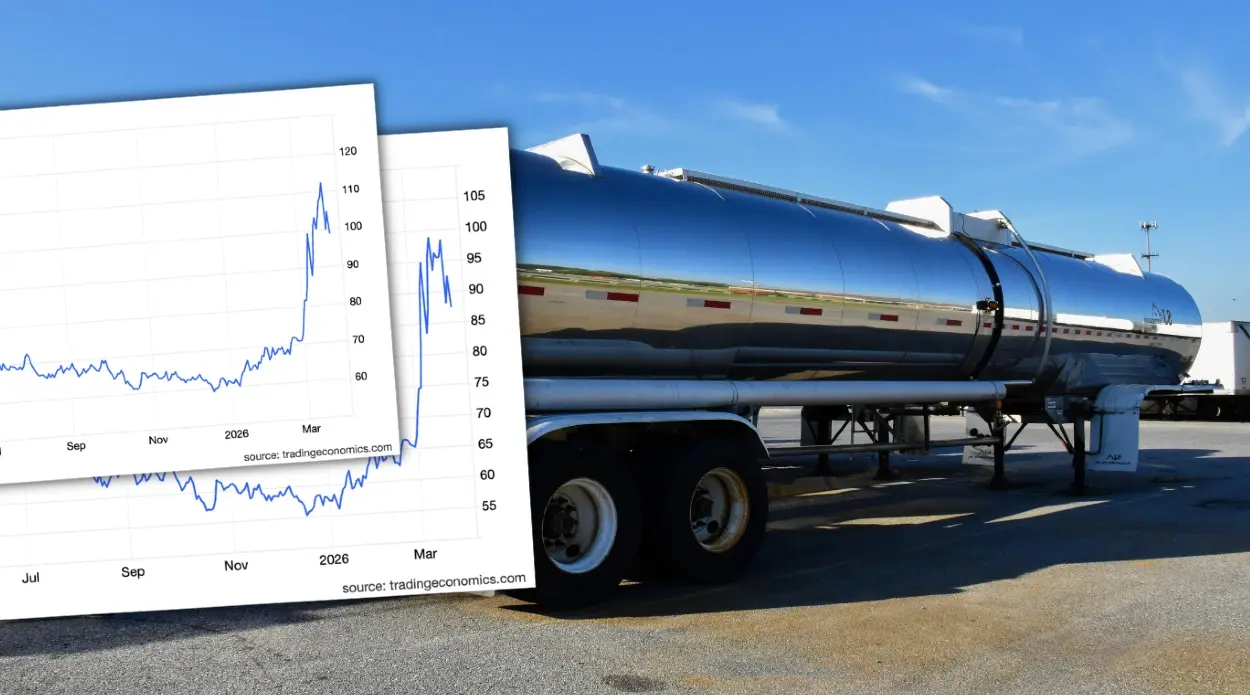
During yesterday’s session Brent Crude oil broke below support at $83.65 and the 0.786 Fibonacci retracement at 81.43 but managed to close above forming a Hammer candle which is and indication of a bottom and reversal.
A bullish candle today could signal a reversal from the current downtrend. A reversal that could take Brent to the 0.618 retracement of the November selling at around 92.32.
However, to reverse the medium-term bearish picture a weekly close above 99.56 is needed.
The RSI is showing negative sentiment and but testing its falling trendline. A close above could be an indication of this bounce could turn in to a reversal with higher Oil prices.
However, if selling pressure returns and sends Brent below 82.40 the down is likely to extend down to 77 possibly lower.


WTI crude oil bounced from support at around 74.27 and from the upper side of the upper falling trend line in what seemed like a falling wedge pattern. WTI formed a Hammer candle indicating a bounce that could take WTI to the 0.618 retracement at 86.05.
At the time of writing RSI has broken above its short-term falling trend indicating this bounce could jump a bit higher. However, the falling daily 55 and 100 SMA’s are providing resistance. If WTI slides back below 73.60 there is not much support until around 66-62.40.
For WTI to reverse the medium term down trend a weekly close above 93.65 is minimum requirement.
Dutch Gas broke side ways out of its steep falling wedge like pattern and haven’t really been able to get some upside traction. But maybe this is the time. It has broken out of its triangle like pattern and if Dutch Gas moves higher to close above €147 a new uptrend has been established.
An uptrend with potential to move toa around 175-188.
RSI still showing negative momentum but that will change if it can close above 60 threshold.
If Dutch Gas slides back below it very short-term falling trend line in the triangle like pattern it is likely to test October lows around 92.40
Henry Hub Natural Gas is volatile around $7.18 which was the resistance to break for bullish signal. 200 daily SMA seems to offer support an Henry Hub is set for higher levels. RSI showing positive sentiment supports this picture.
However, that could all be changed if Henry Hub closes back below 6.50 for a test of support around 5.55