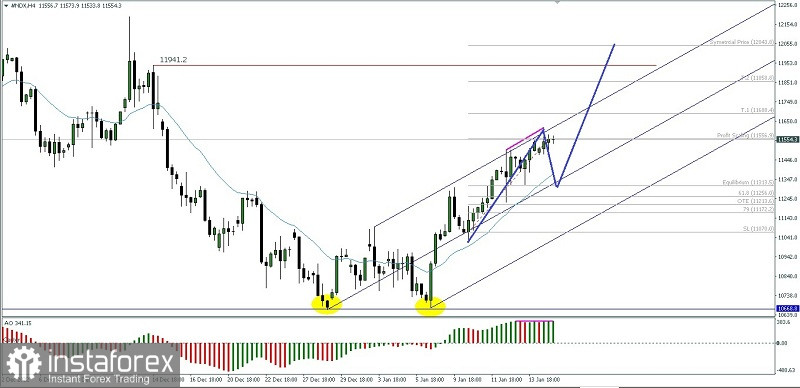
If we look at the 4-hour chart of the NASDAQ 100 index, we can see some interesting facts:
1. #NDX is moving inside the Bullish Pitchfork channel.
2. The price is above the Moving Average.
3. There is a Double Top Pattern (Yellow Circle).
Based on the three facts above #NDX has the potential to appreciate the rally up where the 1688.4 level will be tested to be penetrated above and if this level is successfully broken then it is not impossible that the next level to aim for is the 11941.2 level, but please be careful with deviations between movements prices with the Awesome Oscillator indicator which implies a downside potential as well especially if there is a penetration below the 11017.9 level then all scenarios previously described will cancel by themselves.
Relevance up to 05:00 2023-01-19 UTC+1 Company does not offer investment advice and the analysis performed does not guarantee results. The market analysis posted here is meant to increase your awareness, but not to give instructions to make a trade.