
If we look at the 4-hour chart, the S&P 500 index shows a number of interesting things
:
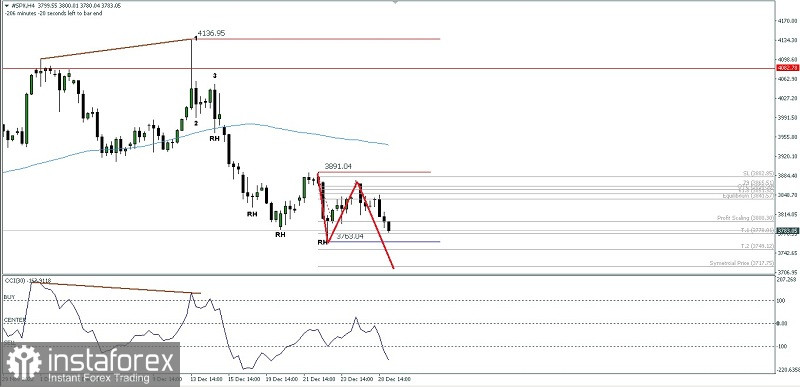
1. Price movement below its 100 period Moving Average.
2. There is a deviation between #SPX price movement with CCI indicator.
3. There was a failure to level 100 and turned down level 0 again on the CCI indicator.
4. the formation of a Bearish 123 pattern followed by the shooting of Ross Hook (RH) several times.
Based on thefew things above, we have an indication that the #SPX condition is still dominated by sellers where in the near future #SPX will try to break below the nearest Ross Hook (RH) level, namely at the 3763.04 level if this level manage to broke then most likely of the next level to go to is in the range of the area level 3749.12-3717.75, but if on the way to the target levels mentioned earlier a correction suddenly occurs upwards past the 3891.04 level then the decline scenario described earlier will become invalid and cancel automatically.
Relevance up to 03:00 2022-12-30 UTC+1 Company does not offer investment advice and the analysis performed does not guarantee results. The market analysis posted here is meant to increase your awareness, but not to give instructions to make a trade.