


Separation is an unpleasant thing, but it happens from time to time. In the second half of September, bitcoin stopped being led by the US stock market. The leader of the cryptocurrency sector is trading near the psychologically important mark of 20,000, despite the rampant fall in US stock indices, due to the aggressive monetary restriction of the Fed. If the S&P 500 was scared by the intention of the central bank to raise the federal funds rate to 4.25–4.5% this year, then BTCUSD is in no hurry to fall.
20,000 for one coin is an important mark not only in terms of price, but also in terms of capitalization. The market value of cryptocurrencies is currently estimated at $1 trillion. This is $2 trillion less than at the peak of BTCUSD in November 2021. And although the token has since sank by 70%, and the S&P 500 by only 22%, in September, the situation changed.
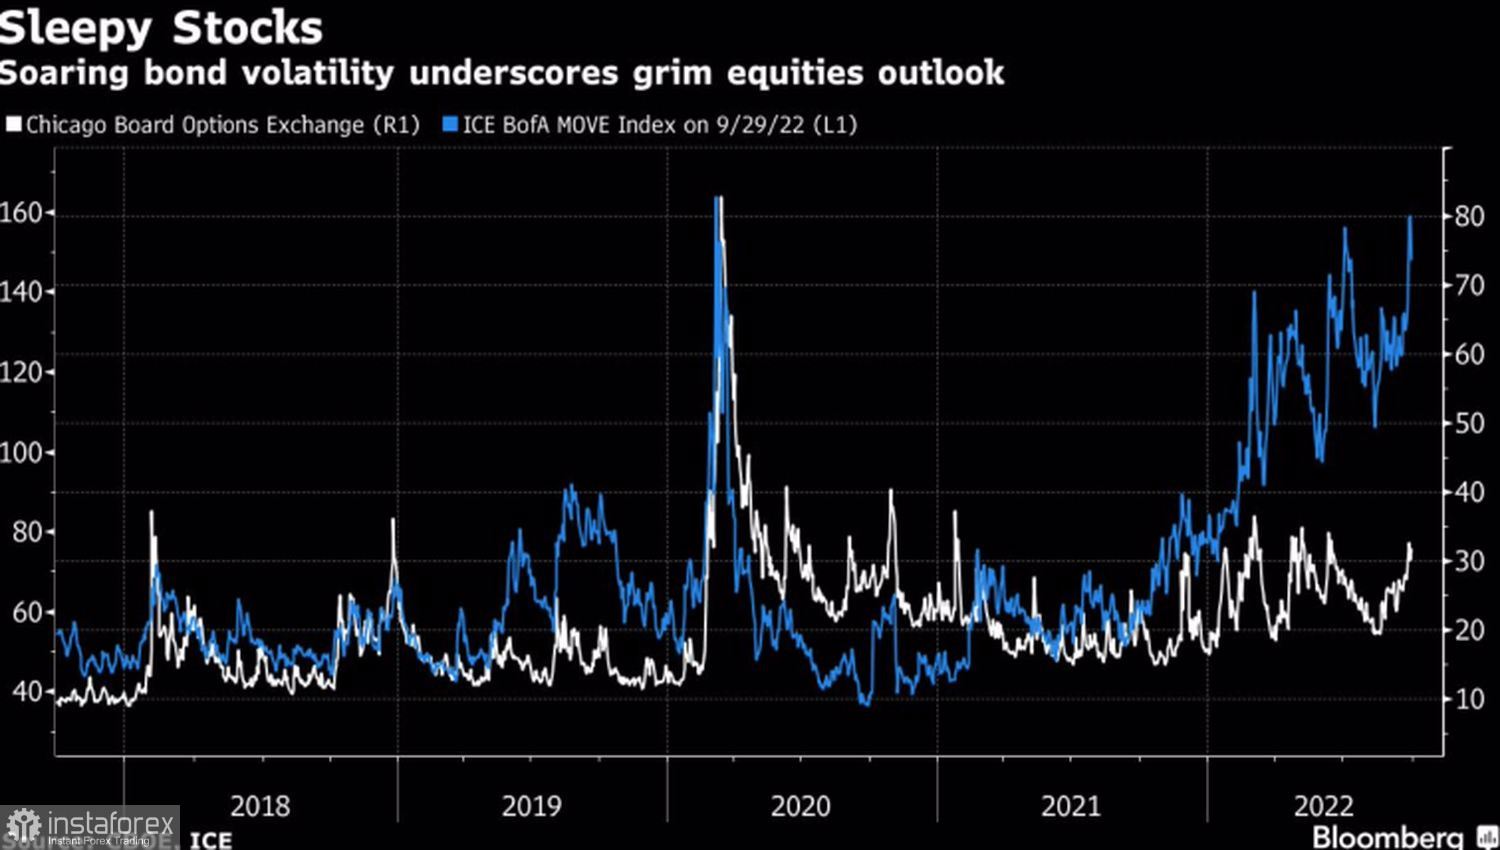
Stock indices are falling on fears that an overly aggressive tightening of the Fed's monetary policy will cause a recession in the US economy. At the same time, the stock market has not yet fully taken into account the risks of a downturn, as evidenced by the VIX fear index. The volatility of equity securities is currently substantially lower than that of debt securities. They most likely have somewhere to fall.
Dynamics of volatility of the US stock and bond markets
Is there a place for bitcoin to fall? Big question. Unlike trading in the US financial market, no additional margin is required to hold losing positions in cryptocurrencies. You can hold them for as long as you like, with the expectation that, eventually, the price will still rise and take you out of losses. Such stubborn holders are called hodlers, and their number is currently growing. This is a distinctive feature of crypto winter 2022. During the previous periods of BTCUSD falls, everything was different.
Strong non-sell hands keep the token from falling too low. Of course, everything can change if bitcoin rewrites the June lows, but until this happens, you can talk about the ability of the cryptocurrency leader to find the bottom.


Note that the external background for bitcoin as a representative of risky assets remains extremely unfavorable. FOMC officials are openly talking about their readiness to raise the federal funds rate to 5% in 2023. This will certainly allow Treasury yields to restore the upward trend after the correction associated with the intervention of the Bank of England in the life of the debt markets. The higher bond rates rise, the worse it is for stocks and all earning assets. Bitcoin is no exception.
Technically, on the daily chart of BTCUSD, there is a consolidation within the medium-term downward trend. A series of rising highs and lows indicates a serious struggle for the initiative between the "bulls" and "bears" and contributes to forming the Broadening Wedge reversal pattern. The conservative strategy is to buy the peak at 22,800. A more aggressive approach involves opening long positions on a breakout of the fair value at 19,900.
Relevance up to 10:00 UTC+2 Company does not offer investment advice and the analysis performed does not guarantee results. The market analysis posted here is meant to increase your awareness, but not to give instructions to make a trade.


