


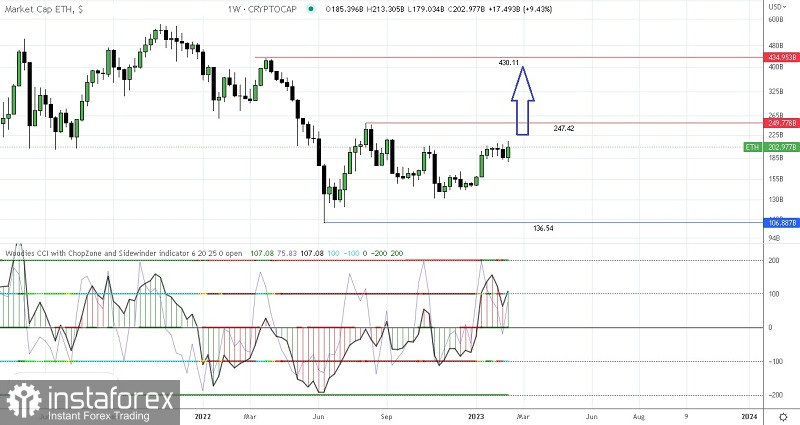
Currently on the Ethereum Cryptocurrency weekly chart there are several things that we should pay attention to, such as:
1. Sidewinder (SI) indicator in green colour which means trending and volatile once.
2. Chopzone (CZ) indicator in cyan blue which means Bullish market condition.
3, Zero Line (ZL) is green which indicates market conditions are also being bull.
4. There is a Hook on CCI (20) histogram.
5. Histogram CCI has turned green, it means that the bull is ripe.
Based on the five things above, it can be concluded that in the next few days Ethereum has the potential to appreciate up to the level of 247.42 as the first target and level 430.11 as the second target, but if on its way to the targets the levels that have been described suddenly Ethereum has been corrected downwards to break below the 136.54 level, so all the bull scenarios described above will become invalid and cancel automatically
Relevance up to 06:00 UTC+1 This information is provided to retail and professional clients as part of marketing communication. It does not contain and should not be construed as containing investment advice or investment recommendation or an offer or solicitation to engage in any transaction or strategy in financial instruments. Past performance is not a guarantee or prediction of future performance. Instant Trading EU Ltd. makes no representation and assumes no liability as to the accuracy or completeness of the information provided, or any loss arising from any investment based on analysis, forecast or other information provided by an employee of the Company or otherwise. Full disclaimer is available here.


