Ethereum is trading in the red at 1,192 on the H1 at the time of writing. You knew from my previous analysis that the price developed a bearish pattern. Still, the altcoin moved somehow sideways in the short term, so we'll have to wait for a fresh opportunity.
ETH/USD is down by 0.30% in the last hour and by 2.26% in the last 7 days. It tried to rebound in the short term only because BTC/USD bounced back.
ETH/USD Rising Wedge Violated!
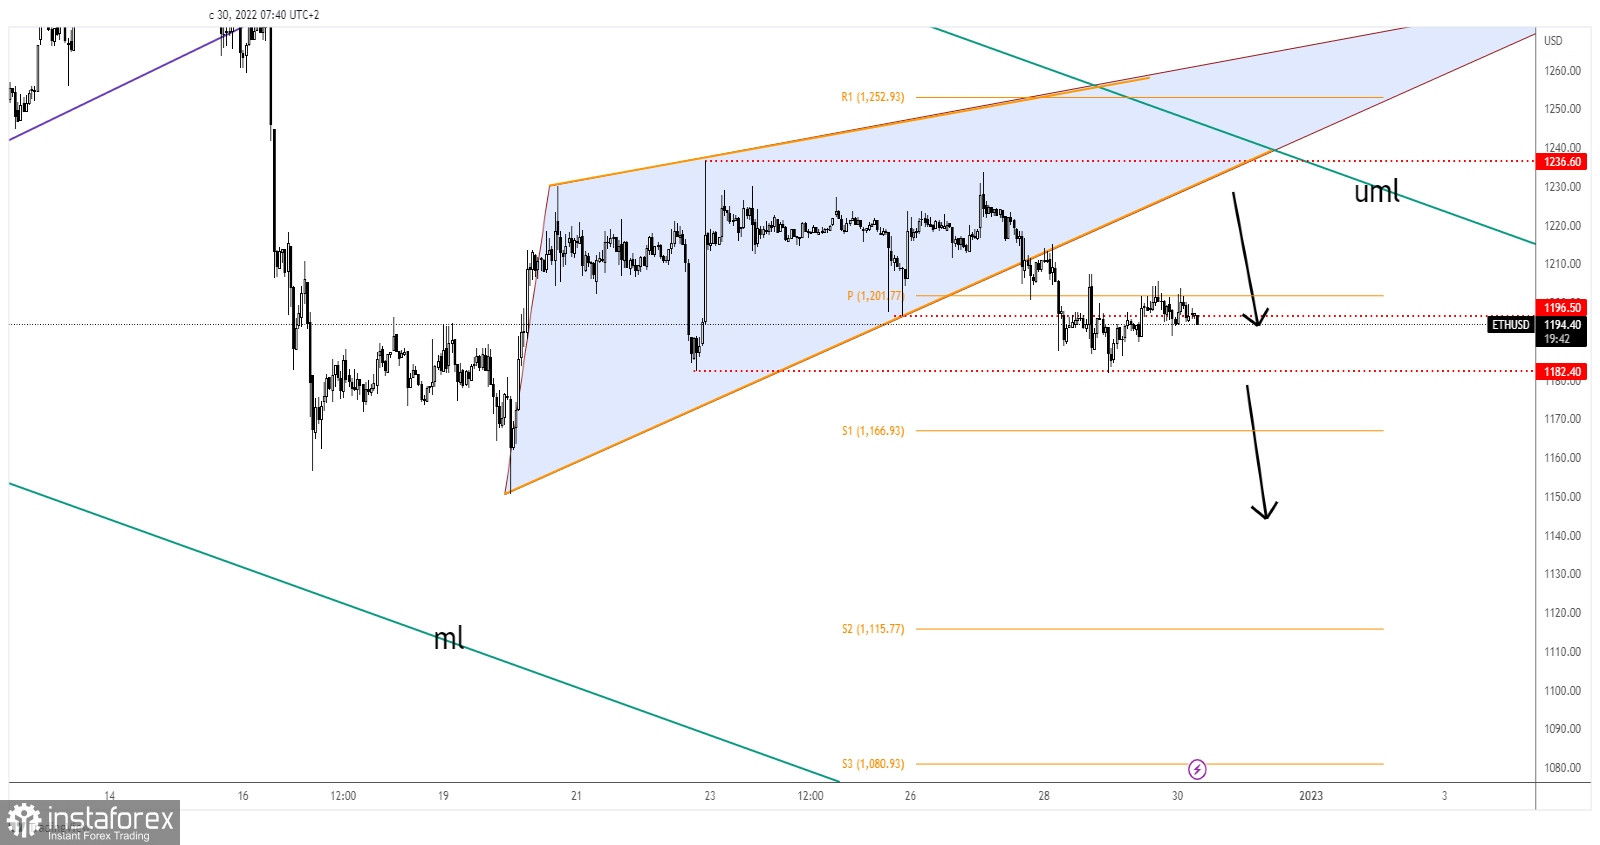
As you can see on the H1 chart, ETH/USD escaped from the Rising Wedge pattern but it found support on the 1,182 former low. It retested the weekly pivot point of 1,201 which stands as an upside obstacle.
Technically, as long as it stays below the upper median line (uml) of the major descending pitchfork, ETH/USD could drop deeper as the bias remains bearish.
ETH/USD Forecast!
Ethereum seems undecided in the short term. Still, a valid breakdown below 1,182 could open the door for more declines.
Relevance up to 07:00 2022-12-31 UTC+1 Company does not offer investment advice and the analysis performed does not guarantee results. The market analysis posted here is meant to increase your awareness, but not to give instructions to make a trade.