Bitcoin Cash continues to move somehow sideways in the short term. It was located at 99.58 at the time of writing. BTC/USD's retreat forced the altcoin to slip lower as well. Still, technically, BCH/USD stays above a buying zone.
It remains to see how BTC/USD will react in the short term. Bitcoin's deeper drop should force the altcoin to drop as well. BCH/USD has dropped by 0.47% in the last 24 hours.
BCH/USD Sideways Movement!
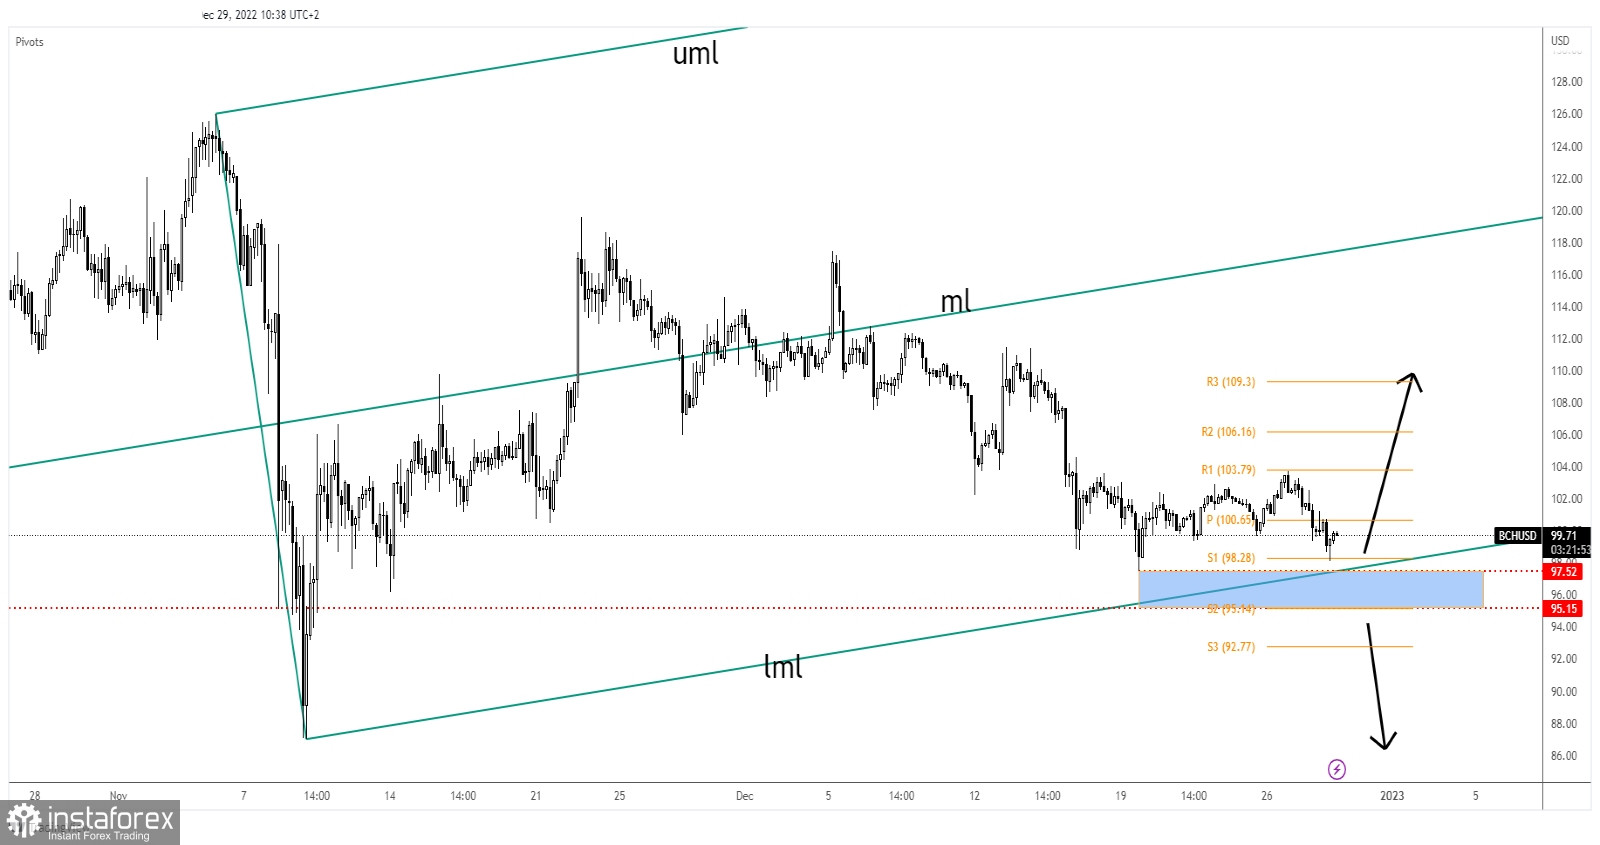
From a technical point of view, the 97.52 - 95.15 zone stands as a support zone, while the ascending pitchfork's lower median line (lml) represents dynamic support. As long as it stays above these levels, the altcoin could develop a new leg higher.
Only dropping and stabilizing below the lower median line (lml) and under 95.15 could invalidate a swing higher and could open the door for more declines.
BCH/USD Forecast!
Testing and resting the support levels as well as registering only false breakdowns could bring a new bullish momentum. This scenario is seen as a long opportunity.
Relevance up to 09:00 2022-12-30 UTC+1 Company does not offer investment advice and the analysis performed does not guarantee results. The market analysis posted here is meant to increase your awareness, but not to give instructions to make a trade.