|
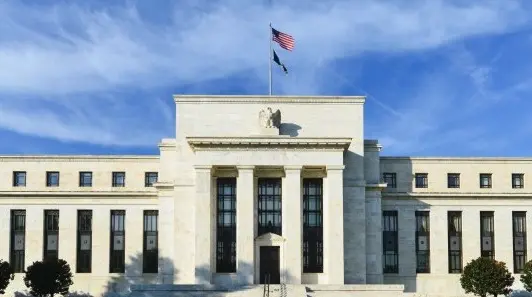
US house prices recorded a second consecutive MoM decline in August, something that the market hasn't experienced since early 2012. Demand is weakening as mortgage rates surge while housing inventory for sale is on the rise, meaning further large price falls are probable. Bad news for new homeowners, but it can help to get broader inflation lower quickly
|

| US house prices fell in August – the second consecutive month-on-month decline | Source: Shutterstock |
|
| -1.3%MoM |
Change in US 20-City house prices
|
|
Demand-supply dynamics are shifting rapidly
US house prices nationally are up more than 40% since the start of the pandemic as huge fiscal and monetary stimulus fueled demand for homes while working from home also opened more alternatives of where to live. At the same time, supply was limited with new construction slow to catch up. However, we are now entering a very different environment.
The July S&P Case Shiller house price report recorded the first month-on-month fall in over 10 years and now we have the second. After July's 0.7% MoM drop they fell 1.3% in August in the 20 major cities, taking the year-on-year rate of appreciation down to 13.1% from 16%. Every city experienced a price fall, but once again most of the major pain is on the West Coast with Seattle down 3.9% MoM after a 3% fall in July while San Francisco fell 4.3% MoM after July's 3.5% decline. New York, Cleveland and Chicago saw much smaller falls, but then again prices didn’t rise as rapidly on the way up.
|
|
US house price levels since February 2020

|
|
House prices could fall more than 20%
Mortgage rates have more than doubled since the start of the year to nearly 7%, making it much more challenging to meet monthly mortgage payments – the typical monthly mortgage payment on a 30Y fixed rate mortgage is now above $2,600! Meanwhile, the rising cost of living and falling equity markets amid a general lack of affordability have made it more challenging to save enough of a down payment for first time buyers – the lifeblood of the market.
At the same time housing supply is on the rise with the stock of new homes for sale up 50% since February while the number of existing homes for sale is up 64% since the October 2020 low. This means we are moving from a market that was suffering from significant excess demand to one where there is a risk of modest excess supply dominating the story over the coming year, especially if recessionary forces result in rising unemployment.
As we referred to in a previous note, the median price for an existing home is 5.3 times the median level of household incomes, higher than even at the peak of the housing boom of the mid-2000s. To get us back to the long-run average house price-to-income ratio of around 4 on a three-year horizon would imply prices falling peak-to-trough by around 20% while assuming nominal incomes rise 3% in each year.
|
|
Some cities are more vulnerable to large corrections than others

|
|
But this can help get consumer price inflation close to 2% by end-2023
One positive is that over the longer term this should help to get broader inflation measures lower with CPI getting close to 2% by end-2023 given the relationship with the shelter components that go into CPI.
|
|
House price inflation leads turning points in the CPI shelter components

|
|
As the chart above shows there is normally a lag of 12-14 months between turning points in house prices and the shelter CPI components since rents typically change only once a year so there is a slow response while perceptions of housing costs also take time to change for Owners' Equivalent Rent. However, evidence from rent.com and realtor.com suggest actual rents are already trending lower.
It may well be that the rising cost of living and elevated rent level and the consequent strain on finances means people are sharing with friends and family rather than going out to rent on their own. If so, we could see a much swifter turn in shelter CPI than we would normally have expected, which given it's one-third weighting within the CPI basket of goods and services, could help to get inflation down to 2% far quicker than many in the market expect.
|
|
| Read this article on THINK |
Tags
US Recession Prices Inflation Housing
Disclaimer
This publication has been prepared by ING solely for information purposes irrespective of a particular user's means, financial situation or investment objectives. The information does not constitute investment recommendation, and nor is it investment, legal or tax advice or an offer or solicitation to purchase or sell any financial instrument. Read more


