Quotes on the weekly chart of the S&P 500 bounced down from the upper boundary of the price channel. The Marlin oscillator also turned down, showing an intention to move into negative territory.
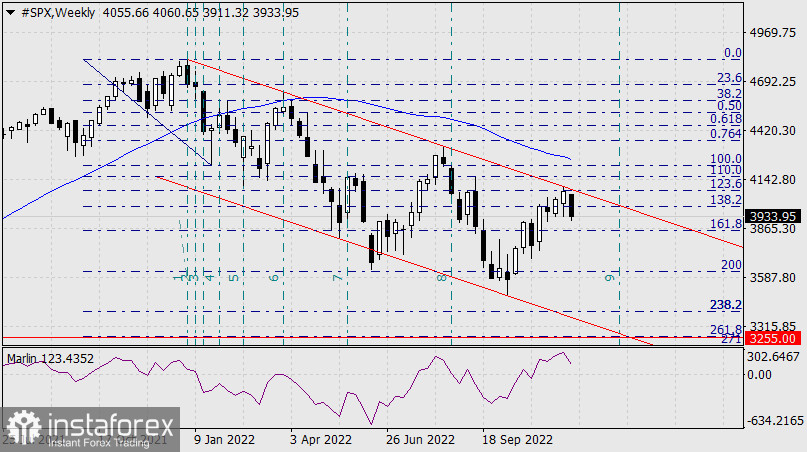
Most likely, the decline will end the current Fibonacci movement, with the line of the 9th timeframe crossing the lower limit of the price channel - at 3255.00. This level coincides with the 261.8% retracement level, so there is a high chance that quotes will hit the target level by January next year.
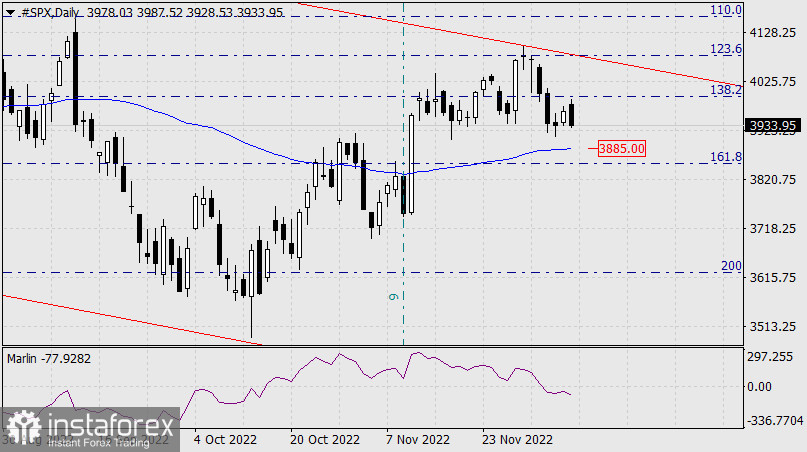
In terms of the daily chart, quotes reversed towards the MACD line, and moving beyond 3885.00 will be a signal for a more decisive downturn, especially since the Marlin oscillator is already in negative territory.
Relevance up to 04:00 2022-12-13 UTC+1 Company does not offer investment advice and the analysis performed does not guarantee results. The market analysis posted here is meant to increase your awareness, but not to give instructions to make a trade.