Technical analysis:
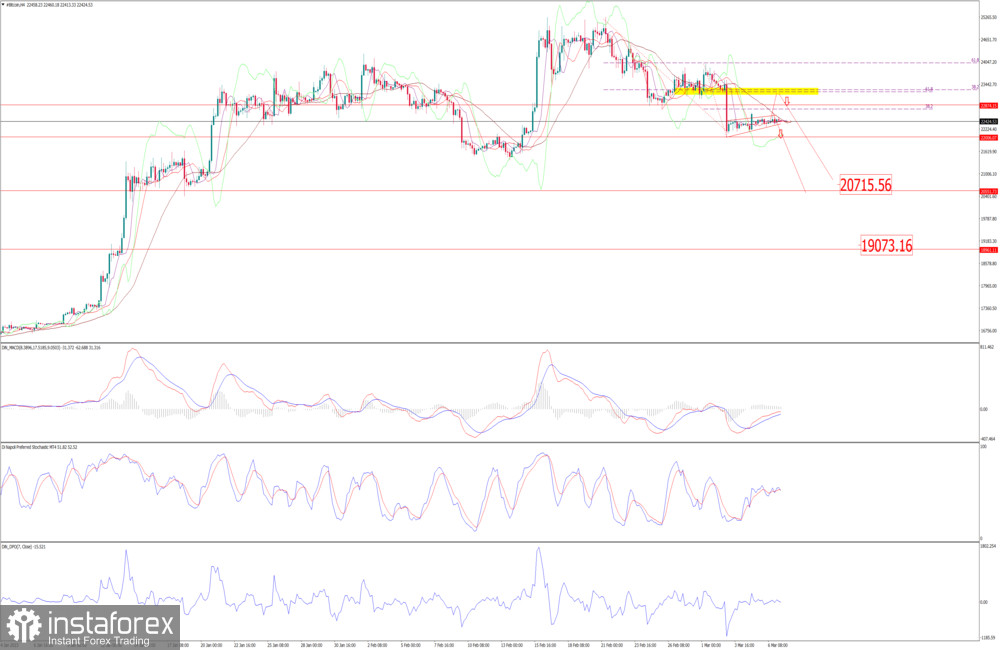
BTC/USD has been trading sideways at the price of $22.425. I see potential for the downside continuation.
In case of the breakout of the flag pattern, I see potential for the drop towards $20.7150 and $19.000
In case of the rally first, there is key resistance zone at $23.200.
Stochastic is showing the potential bear cross.
Key resistance is set at the price of $23.200
Relevance up to 08:00 2023-03-08 UTC+1 This information is provided to retail and professional clients as part of marketing communication. It does not contain and should not be construed as containing investment advice or investment recommendation or an offer or solicitation to engage in any transaction or strategy in financial instruments. Past performance is not a guarantee or prediction of future performance. Instant Trading EU Ltd. makes no representation and assumes no liability as to the accuracy or completeness of the information provided, or any loss arising from any investment based on analysis, forecast or other information provided by an employee of the Company or otherwise. Full disclaimer is available here.
Read more: https://www.instaforex.eu/forex_analysis/315166