Crypto Industry News:
In addition to groups of investors depending on how long they hold BTC, behavior can also be judged by portfolio size. Among all known holders, it is whales with more than 1,000 BTC that attract the most attention from speculators and the entire market. The graph shows the average purchase prices for whales, taking into account only coins entering and leaving cryptocurrency exchanges. Glassnode began measuring the following major bear bottoms by analyzing the best average purchase price for whales for each phase of the cycle.
- Since July 2017, i.e. since the launch of Binance
- From December 2018, at the low of the 2018 bear market
- From March 2020 on the bottom of the COVID sale
All three of these whale groups experienced an average unrealized loss when Bitcoin fell below $18,000 following the FTX implosion in November 2022. Interestingly, however, the recent declines have accelerated with weakening demand at the approximate cost base of BTC accumulating whales from December 2019, i.e. 23,800 In addition, this level coincided with the average purchase price of BTC for a supply older than 6 months, which potentially suggests a) a more permanent weakening of the sentiment b) a more active supply of long-term and also wealthy investors.
Technical Market Outlook:
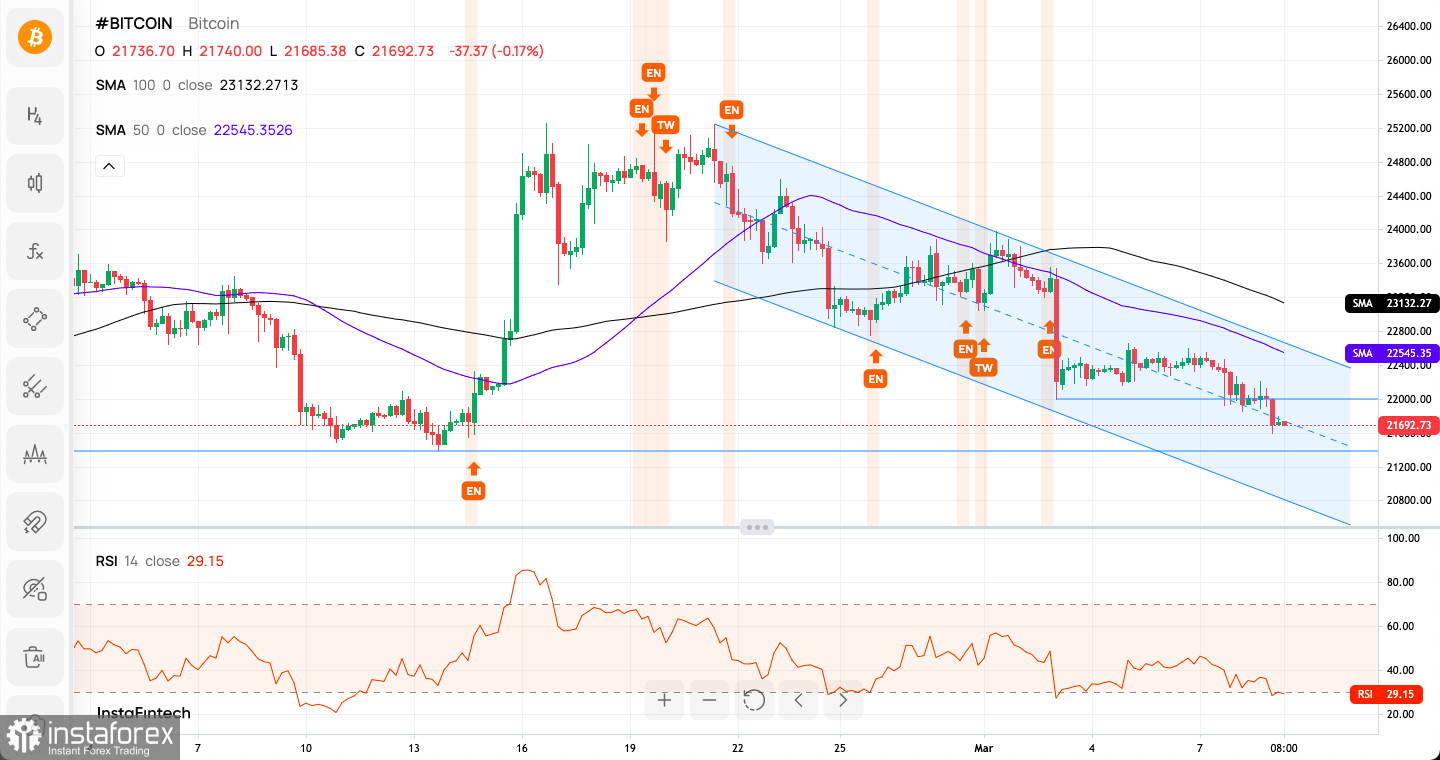
The BTC/USD pair has made another local low in the last 24h and he bears are getting closer to the key technical support seen at the level of $21,429 (13th Feb low). The intraday technical resistance is seen at the level of $22,000. The bears move inside the descending channel on the H4 time frame chart and the weak and negative momentum helps the bears to push the prices lower. The negative bearish divergence on the daily time frame chart between the price and the momentum oscillator supports the bearish outlook for BTC in the coming days.
Weekly Pivot Points:
WR3 - $22,812
WR2 - $22,582
WR1 - $22,470
Weekly Pivot - $22,352
WS1 - $22,240
WS2 - $22,122
WS3 - $21,892
Trading Outlook:
Despite the recent rally, the down trend on the H4, Daily and Weekly time frames continues without any indication of a possible trend termination or reversal. So far every bounce and attempt to rally is being used to sell Bitcoin for a better price by the market participants, so the bearish pressure is still high. The gamechanging level for bulls is located at $25,442 and it must be clearly violated for a valid breakout in the longer term.
Relevance up to 08:00 2023-03-10 UTC+1 This information is provided to retail and professional clients as part of marketing communication. It does not contain and should not be construed as containing investment advice or investment recommendation or an offer or solicitation to engage in any transaction or strategy in financial instruments. Past performance is not a guarantee or prediction of future performance. Instant Trading EU Ltd. makes no representation and assumes no liability as to the accuracy or completeness of the information provided, or any loss arising from any investment based on analysis, forecast or other information provided by an employee of the Company or otherwise. Full disclaimer is available here.
Read more: https://www.instaforex.eu/forex_analysis/315469