The price of Bitcoin dropped to 22,770 on Saturday, where it found demand again. Now, it has rebounded and is trading at 23,378. Technically, the crypto signaled exhausted buyers and a potential larger correction in the short term.
In the past 24 hours, BTC/USD gained 0.70% but was down by 6.05% in the past 7 days. Bitcoin's sell-off forced the altcoins to drop as well.
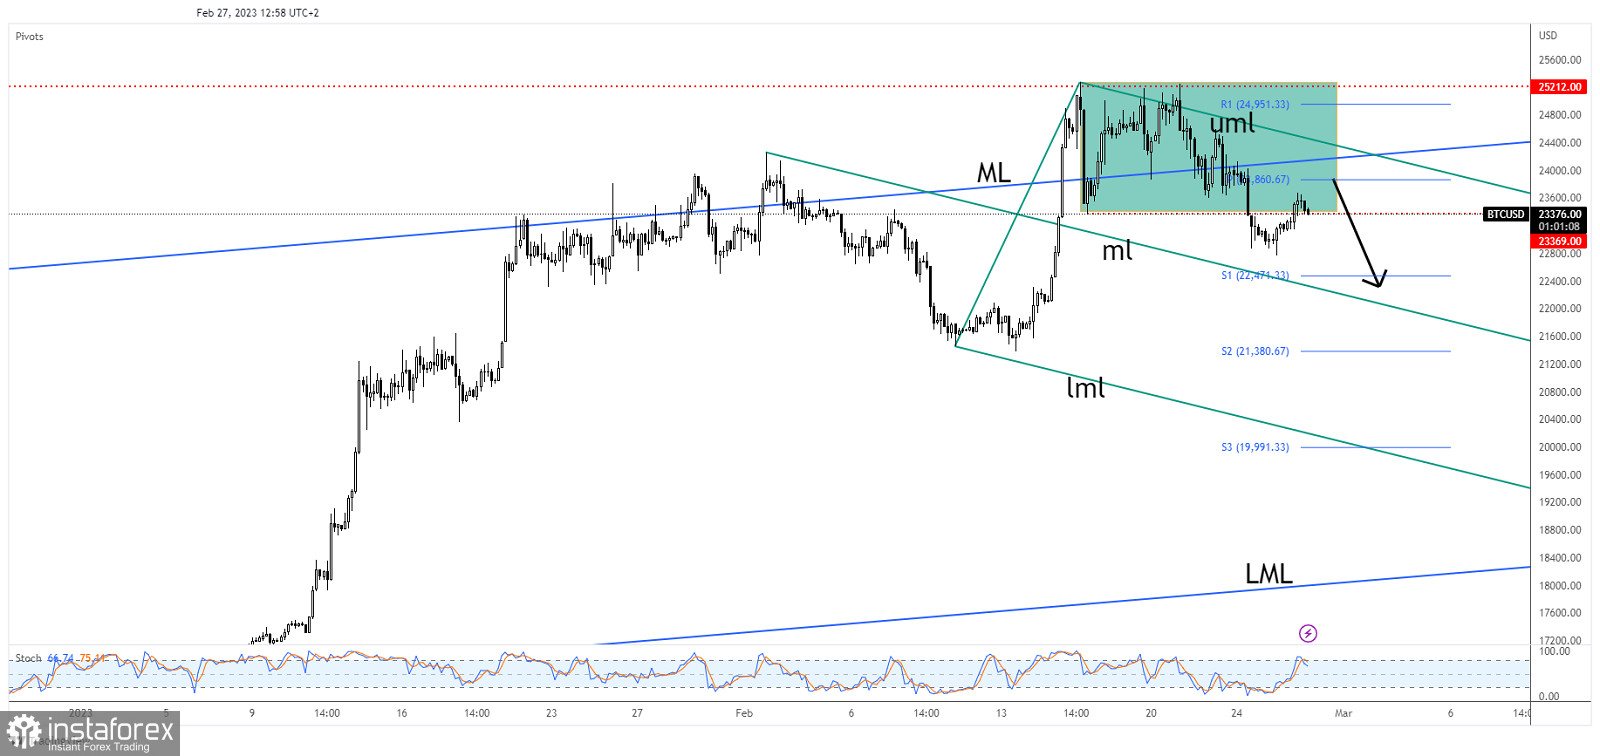
BTC/USD Retesting The Sellers!
BTC/USD escaped from the range between 25,212 and 23,369 signaling a deeper drop. Now, the crypto came back to test and retest the broken downside obstacle. Technically, after its last drop, a temporary bounce back is natural.
The weekly pivot point of 23,860, the median line (ML), and the upper median line (uml) represent upside obstacles.
Read next: EUR/USD Pair Is Trading Around 1.0560, USD/JPY Is Above 136.20, GBP/USD Gained| FXMAG.COM
BTC/USD Outlook!
Testing and retesting the immediate resistance levels, registering only false breakouts may announce that the temporary rebound ended. As long as it stays below the descending pitchfork's upper median line (uml), BTC/USD could extend its downside movement. Temporary rebounds should bring new short opportunities. The median line (ml) acts as a magnet and it could attract the price
Relevance up to 12:00 2023-02-28 UTC+1 This information is provided to retail and professional clients as part of marketing communication. It does not contain and should not be construed as containing investment advice or investment recommendation or an offer or solicitation to engage in any transaction or strategy in financial instruments. Past performance is not a guarantee or prediction of future performance. Instant Trading EU Ltd. makes no representation and assumes no liability as to the accuracy or completeness of the information provided, or any loss arising from any investment based on analysis, forecast or other information provided by an employee of the Company or otherwise. Full disclaimer is available here.
Read more: https://www.instaforex.eu/forex_analysis/314154