Bitcoin greeted the New Year in absolute calm and updated its two-year low of trading volumes. The asset continued its consolidation period near the $16.5k level. However, the cryptocurrency intends to spend its birthday more brightly.
After a local upward spurt to the $16.7k level, the main indicators of trading activity in the Bitcoin network continued their upward movement. This may mean that the cryptocurrency is preparing to end its period of consolidation and begin significant price movements.
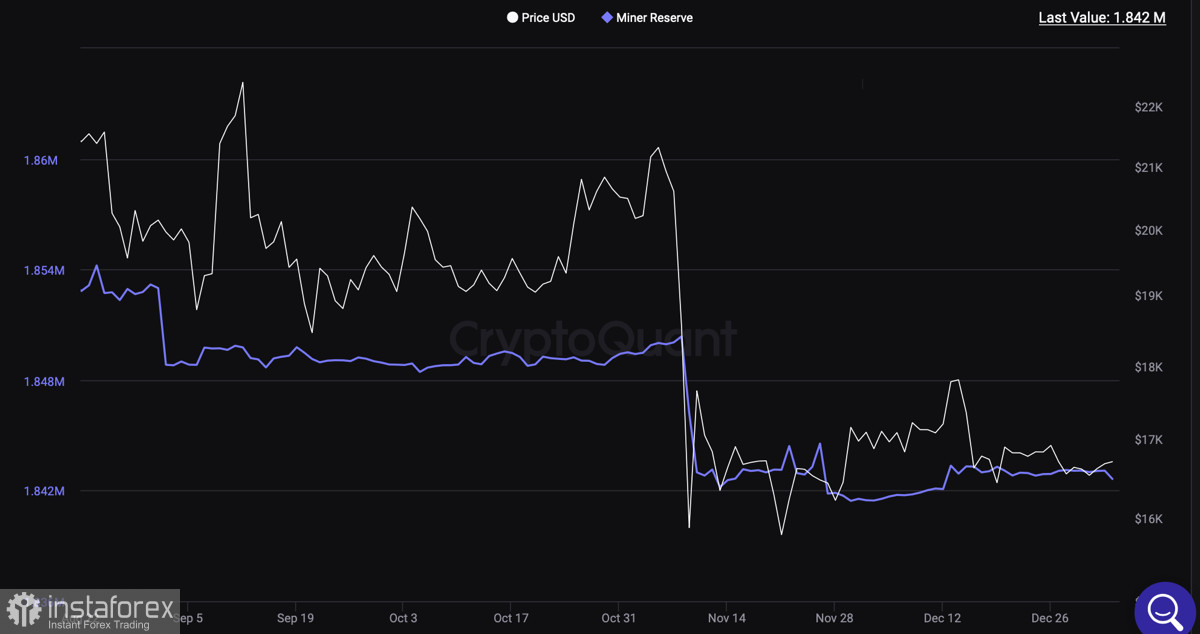
However, it is important to understand that, despite the possible attempts of the upward movement of Bitcoin, they will not be crowned with significant success. Despite the passage of peak moments, the sale of BTC coins by mining companies continues, which greatly complicates the upward movement of the cryptocurrency.
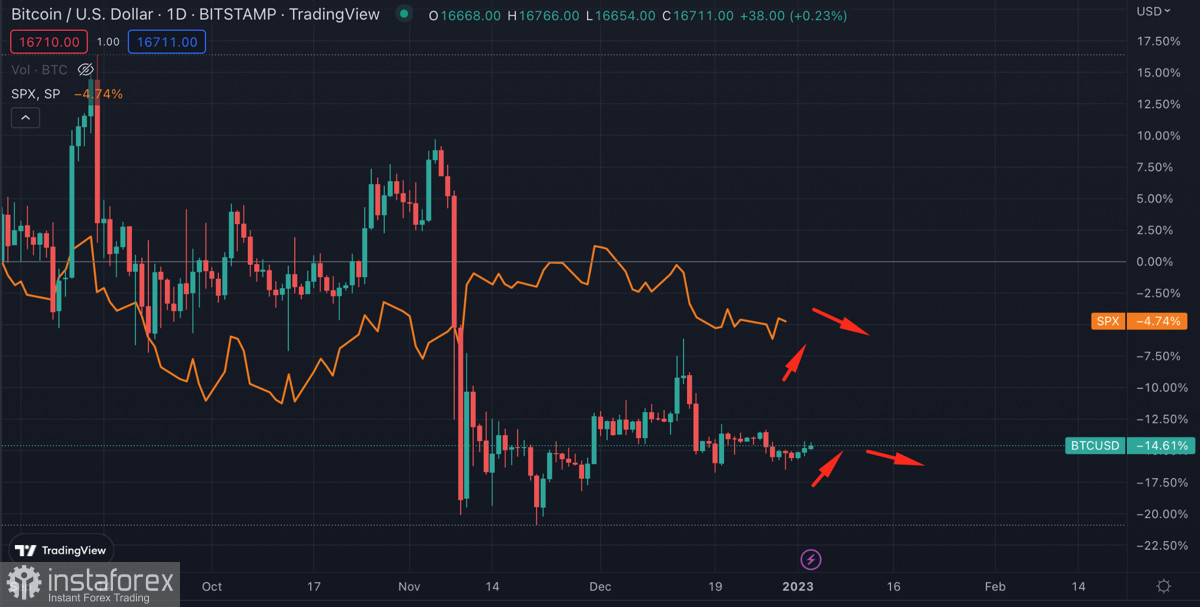
The second key factor is the correlation between Bitcoin and SPX. The trading index completed the local bullish momentum and began to decline. The cryptocurrency duplicates the price action of the S&P 500 with a delay of several days, which may mean a retest of the $16.9k level and a subsequent decline to the usual levels.
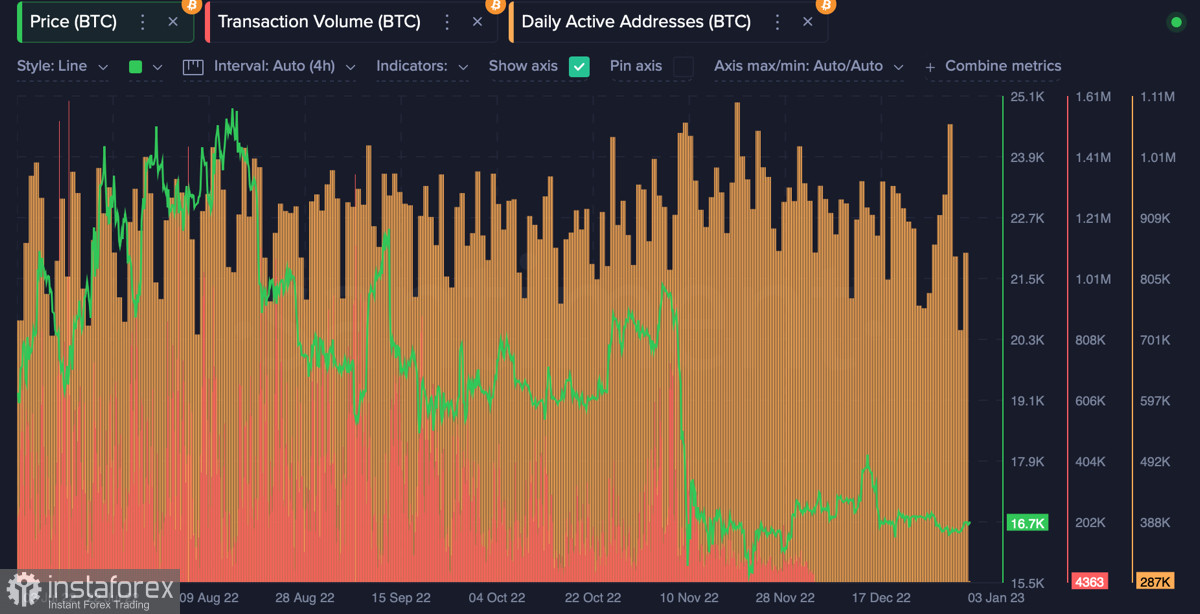
Bitcoin on-chain activity
The network activity of Bitcoin does not show clear signals for the formation or the beginning of an upward movement. There is a divergence on the chart between volumes and the unique number of active addresses.
This may indicate the activation of buyers and the presence of a local upward trend. But at the same time, low trading volumes indicate the absence of a large buyer that can significantly affect the price movement of the cryptocurrency.
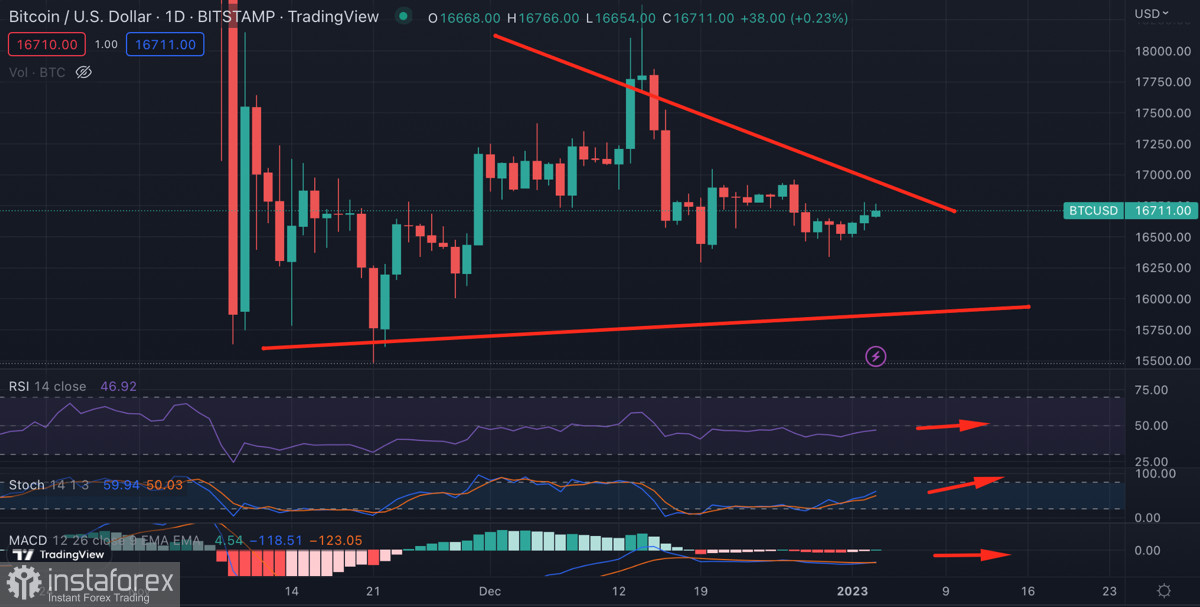
BTC/USD technical analysis
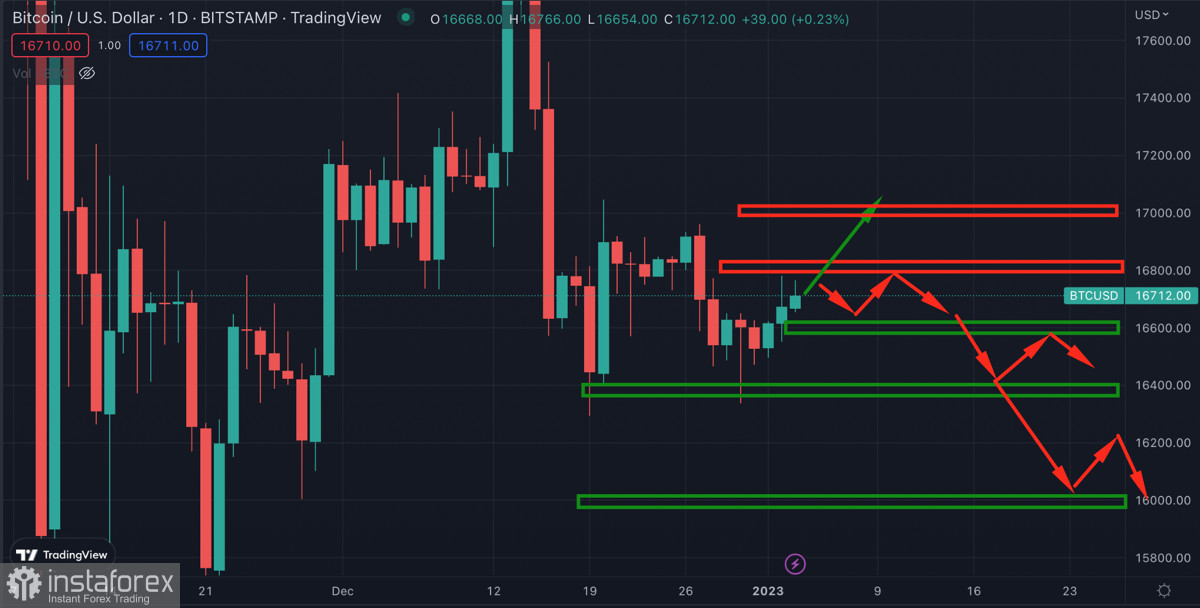
On the daily chart, there are attempts to move the cryptocurrency up to the $16.9k level. Technical metrics show the development of bullish momentum and the continuation of the upward direction. RSI and stochastic oscillator are moving upward, indicating the activity of buyers.
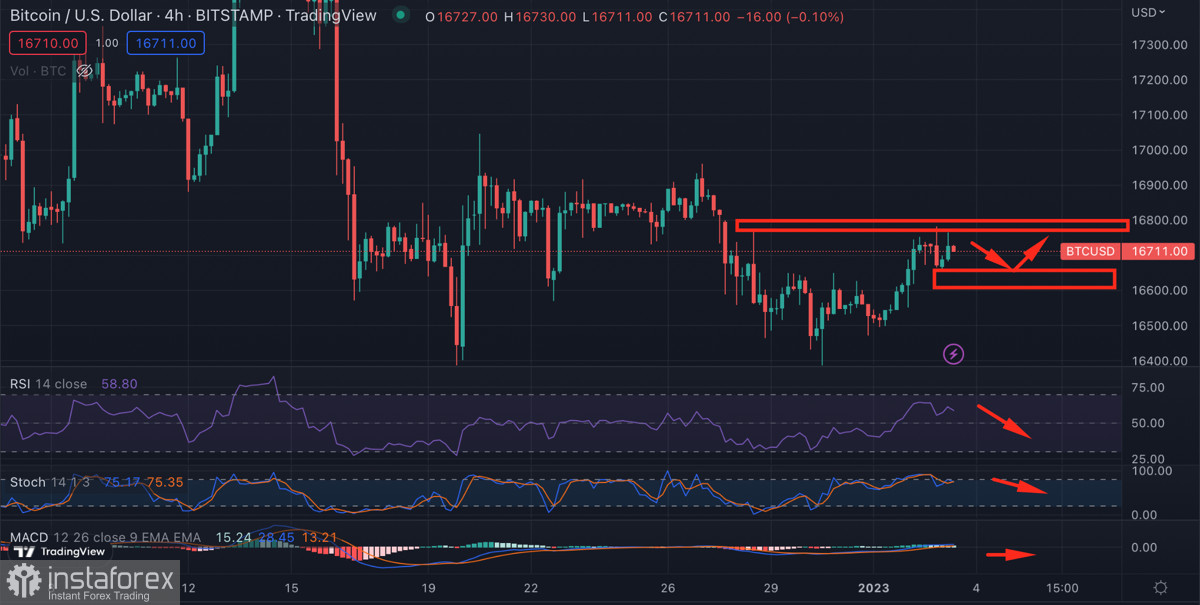
On the four-hour chart, the situation is not so rosy due to the activation of sellers around the $16.7k mark. At the end of yesterday's trading day, the price tested the $16.8k level, but subsequently began to decline. As of writing, Bitcoin is holding the $16.7k level, but for how long?
Technical metrics on the 4H timeframe say that the bullish momentum has run its course, and the price will start to decline. The RSI reversed sharply to the downside, while the stochastic formed a bearish crossover. The signals were formed recently, which means that right now, the cryptocurrency is experiencing the most bearish pressure.
Among the likely scenarios, it is worth highlighting a neutral option, in which an unsuccessful attempt to retest $16.8k ends near the $16.7k level. In this case, BTC continues to consolidate in the $16.5k–$16.7k range. In an unfavorable outcome, Bitcoin rolls back beyond the $16.5k level, and the price moves towards a $16k retest.
Results
The probability of a positive outcome in which Bitcoin breaks the $16.8k level and moves further upward to $17k is also possible. However, technical metrics and ongoing activity point to the main weakness of the attempt to realize bullish momentum—the absence of a strong buyer.
If a major player does not appear soon and the price closes the trading day below $16.7k, we should expect a negative scenario to materialize. But when a major player appears, for example, after the opening of the U.S. markets, the probability of a neutral and positive outcome increases.
Relevance up to 09:00 2023-01-04 UTC+1 Company does not offer investment advice and the analysis performed does not guarantee results. The market analysis posted here is meant to increase your awareness, but not to give instructions to make a trade.
Read more: https://www.instaforex.eu/forex_analysis/331355