

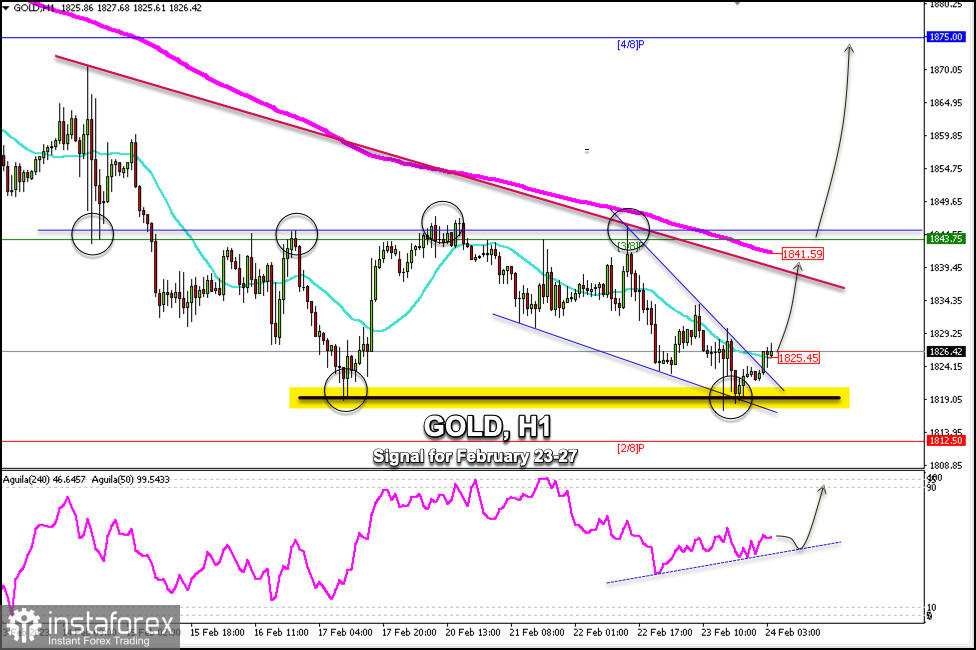
Early in the European session, Gold (XAU/USD) is trading around 1,826.42 above the 21 SMA and below the 200 EMA. On the 1-hour chart, we can see some exhaustion of bearish strength.
Yesterday, Gold reached a low at 1,817.28 which coincided with February 17's low. From that level, it began a technical rebound, which has left a formation of a double bottom.
In case gold trades above 1,817 and above 1,825 (21 SMA), we could expect a recovery and the price can reach 1,841 (200 EMA) and the top of the downtrend channel that was formed from February 14th.
The last support that could stop the fall of gold is located at 1,812 (2/8 of Murray). Around this level, the instrument could start a strong technical rebound.
Gold has strong resistance at around 1,845. If you look at the chart, gold has tried to break this zone on several occasions and could not succeed. A daily close above 3/8 Murray could reinforce the bullish momentum and the price could reach 1,875(4/8 Murray).
Our trading plan is to buy above 1,817 or above 1,825 with targets at 1,841 and 1,875. The pivot point for today is located at 1,824. In case gold continues to trade above this level, we could expect a prolonged rally in the next several hours
Relevance up to 05:00 UTC+1 This information is provided to retail and professional clients as part of marketing communication. It does not contain and should not be construed as containing investment advice or investment recommendation or an offer or solicitation to engage in any transaction or strategy in financial instruments. Past performance is not a guarantee or prediction of future performance. Instant Trading EU Ltd. makes no representation and assumes no liability as to the accuracy or completeness of the information provided, or any loss arising from any investment based on analysis, forecast or other information provided by an employee of the Company or otherwise. Full disclaimer is available here.
