- The 20-day moving average has capped further upside in the USD/JPY so far since last Friday, 21 July.
- BoJ will release its monetary policy decision and latest quarterly outlook report tomorrow, 28 July. The consensus is an upgrade for its FY2023 consumer inflation forecast to be above 2% while maintaining the upper limit of the YCC at 0.50%.
- Recent minor downtrend phase from 21 July 2023 high of 141.95 to today, current intraday low of 139.38 may see a retracement.
- Key resistance zone at 140.70/142.50.
The recent rebound of 456 pips seen in the USD/JPY from the 14 July 2023 minor swing low of 137.24 retested the downward-sloping 20-day moving average last Friday, 21 July that is acting as resistance around 142.10/142.50.
Thereafter, the price actions of USD/JPY retreated twice so far this week at/near the 20-day moving average, declined by 254 pips to print a 5-day intraday low of 139.38 as of today, 27 July Asian session at this time of the writing.
The current short-term weakness of the USD/JPY has materialized ahead of the Bank of Japan (BoJ)’s monetary policy decision tomorrow where the consensus is an upgrade of its consumer inflation forecast to be above 2% (above BoJ’s target) for FY 2023 for its latest economic quarter outlook, and no change on the upper limit of the Yield Curve Control (YCC) programme on the yield of the 10-year Japanese Government Bond (JGB) to capped at 0.50%.
Interestingly, this upper limit of the YCC is a wild card for tomorrow as several ex-BoJ officials have advocated an upward revision to the 0.50% limit as the current economic conditions warrant it such as elevated sticky inflation conditions in Japan where the national-wide core (excluding fresh food), and core-core (excluding fresh food & energy) stood at 3.3% y/y, and 4.2% y/y for June; at a 31-year and 41-year high respectively.
Before BoJ releases its monetary policy decision and updated quarterly projections, BoJ officials will have a chance to access the leading Tokyo area’s consumer inflation data for July which is being released three hours earlier tomorrow as a key input to debate and assess the suitability of a change to the limits of the YCC programme.
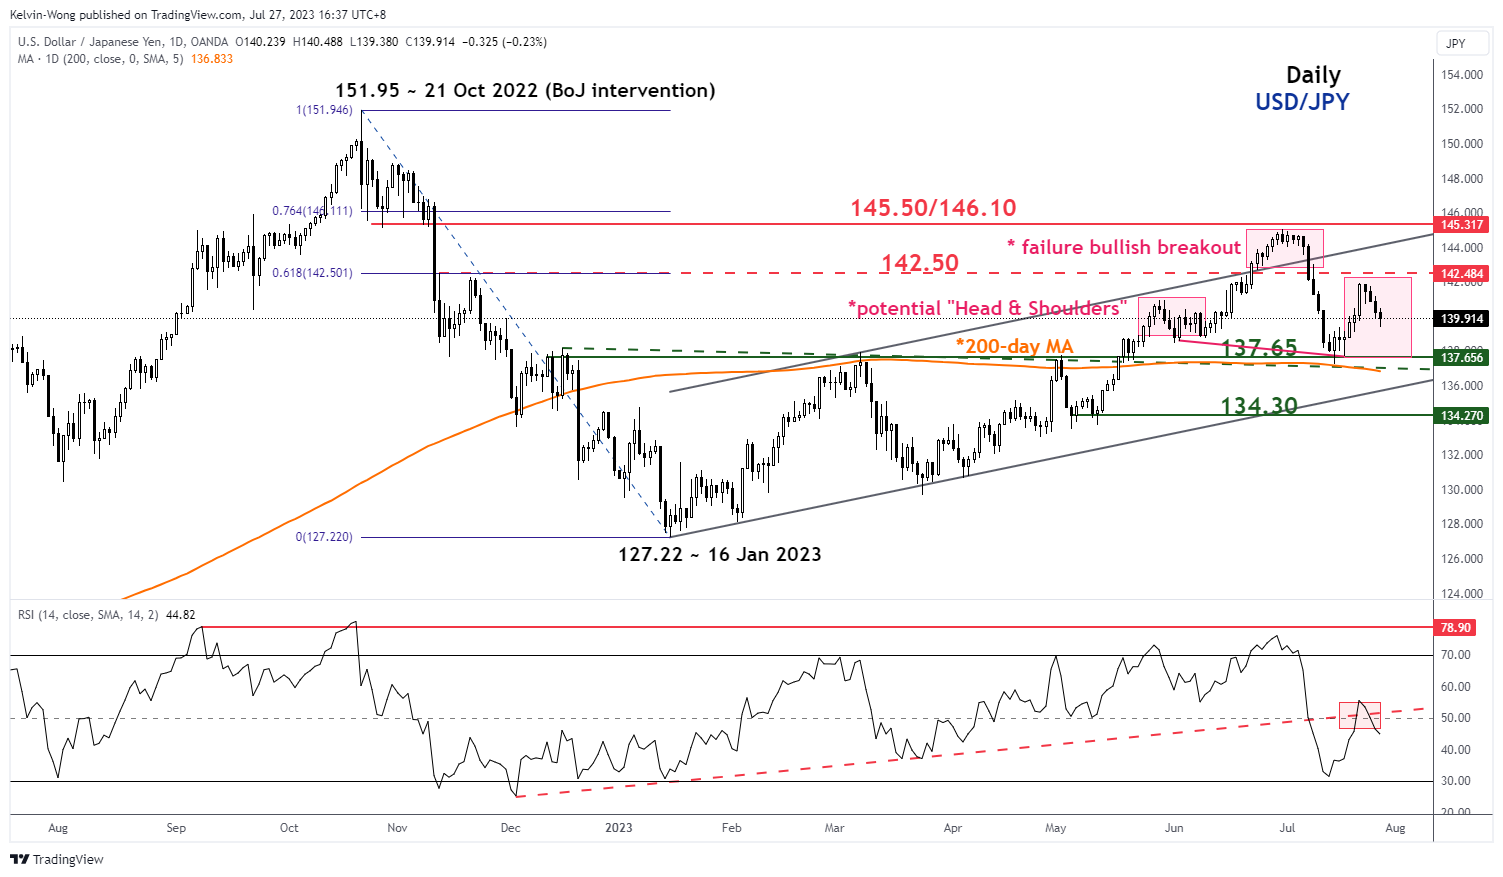
Price actions have traced out a potential medium-term bearish reversal “Head & Shoulders”

Fig 1: USD/JPY medium-term trend as of 27 Jul 2023 (Source: TradingView, click to enlarge chart)
The price actions of USD/JPY have evolved into a potential bearish reversal “Head & Shoulders” configuration since the high of 29 May 2023.
The appearance of this potential “Head & Shoulders” suggests that the medium-term uptrend phase from the 16 January 2023 low of 127.22 to the 21 July 2023 high of 141.95 may have reached its terminal condition where a potential medium-term downtrend phase may materialize next, and a break below the 136.90 neckline support of the “Head & Shoulders” increases the odds.
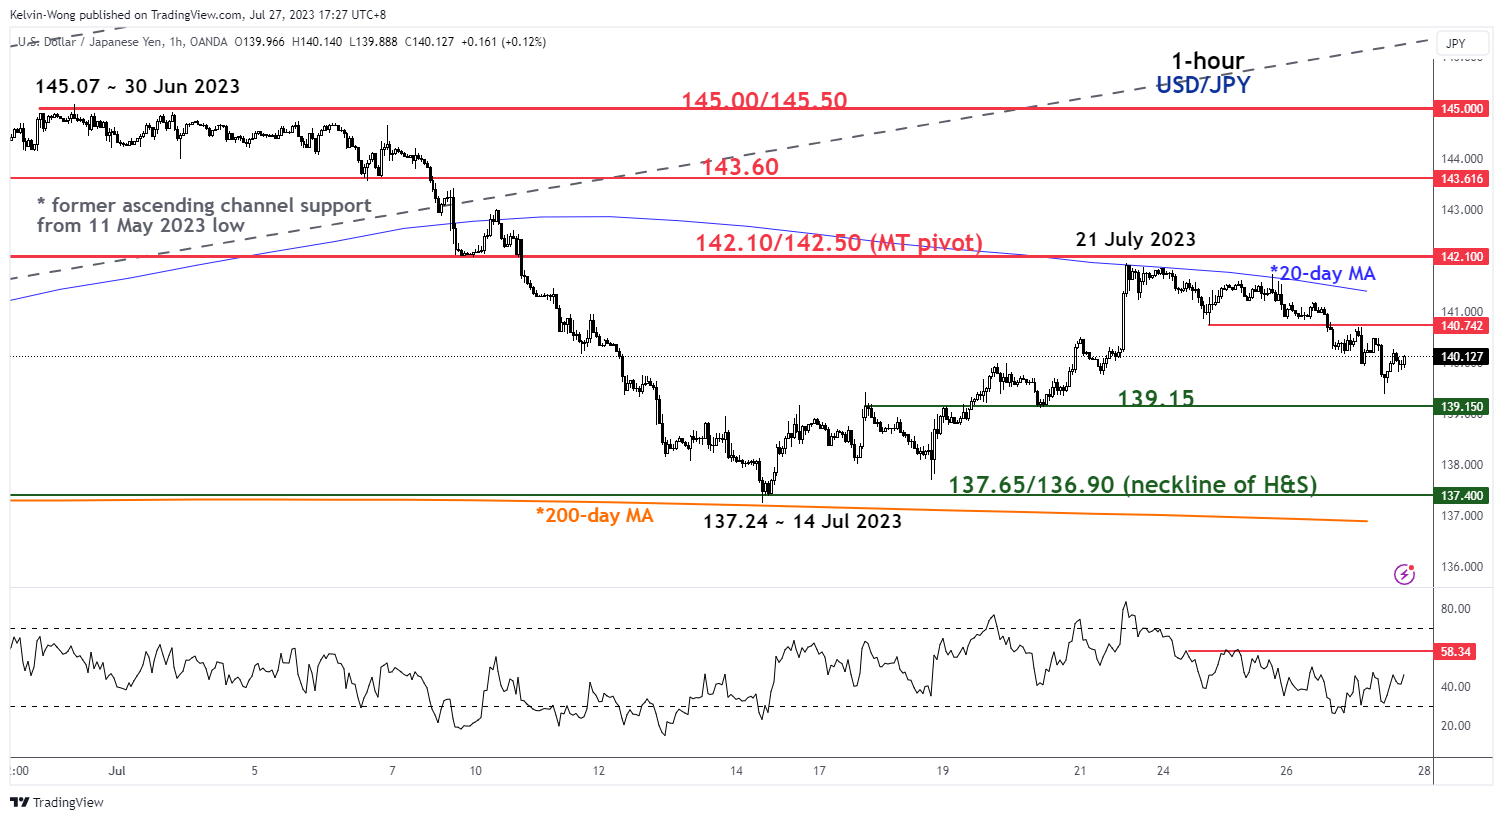
Minor short-term downtrend from 21 July high reached an oversold condition
Fig 2: USD/JPY minor short-term trend as of 27 Jul 2023 (Source: TradingView, click to enlarge chart)
The recent minor downtrend phase from the 21 July 2023 high of 141.95 to today, 27 July’s current intraday low of 139.38 has reached an oversold condition as indicated by the hourly RSI oscillator.
This observation suggests the risk of a minor bounce to retrace a portion of the minor downtrend with the key resistance zone coming in at 140.70/142.50.
Watch the 142.50 key medium-term pivotal resistance to maintain the short-term bearish bias and a break below the 139.15 near-term support exposes the next support at 137.65/136.90 (also the neckline of the “Head & Shoulders” & 200-day moving average).
On the other hand, a clearance above 142.50 invalidates the bearish bias to see the next resistance coming in at 143.60.