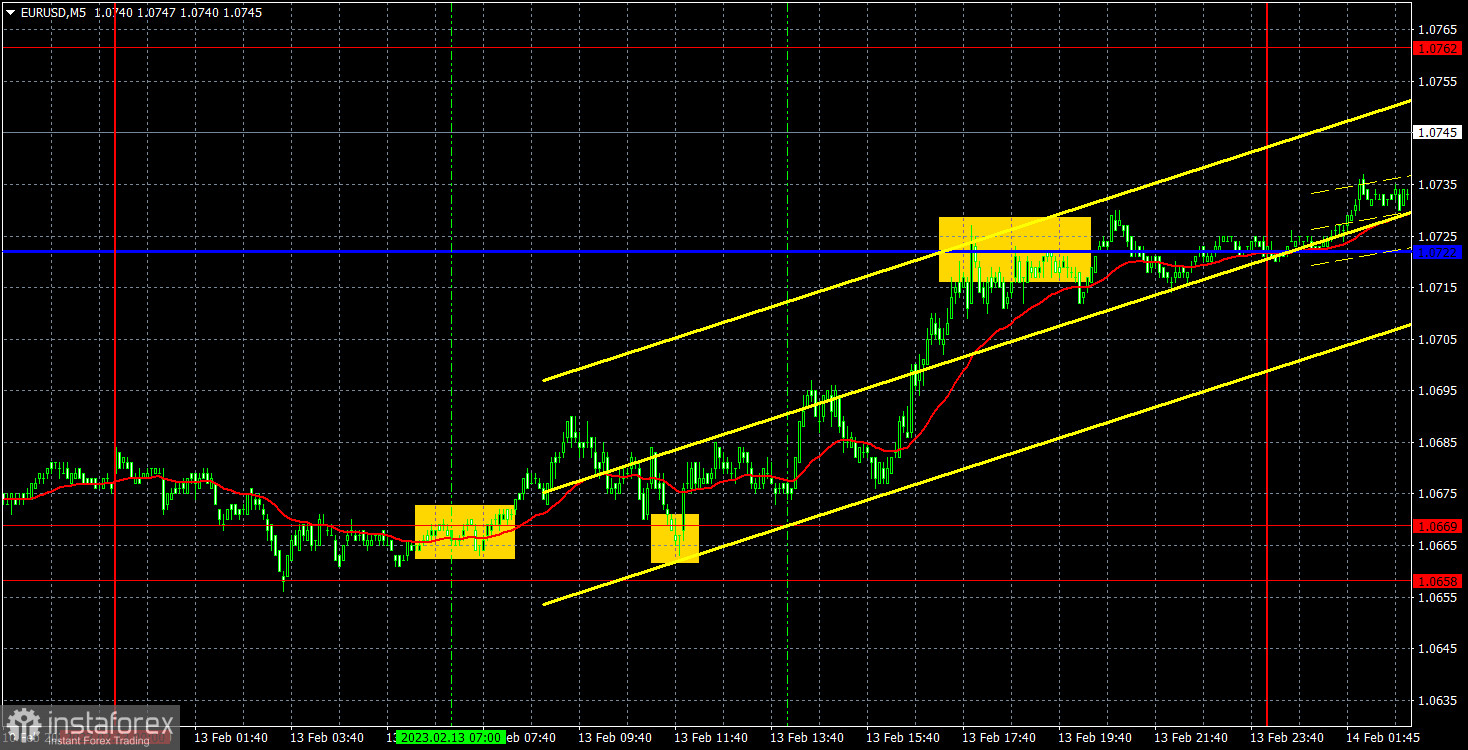
5M chart of EUR/USD
On Monday, EUR/USD rose by several dozens of points, and by the end of the day it was near the critical line, and even managed to overcome it. But overall, the upward movement did not exceed 70-80 pips, so it can hardly be argued that the downtrend was broken. Neither the EU nor the US issued any important reports, and there were no important events. So this movement was definitely not connected with any event and we just witnessed a normal growth. This week there will be many days when the macroeconomic background will be strong, so things can change very quickly. I expect the euro to fall because I don't believe that the bearish correction has completely ended.
Several trading signals were formed on the 5-minute chart. The pair rebounded from the 1.0658-1.0669 area twice during the European session, which were two buy signals. In the first case, the price went up about 10 pips, so traders had to stay in the long position during the second signal. Then the pair started to sharply rise and managed to reach the Kijun-Sen line, where the upward movement ended on Monday. Traders should have locked in profits on the longs, it was not less than 40 pips. With the total volatility of the day about 70 pips, it's not a bad result.
Read next: Poland’s President Andrzej Duda Said The Decision To Send Fighter Jets To Ukraine Was “Not Easy To Take”| FXMAG.COM
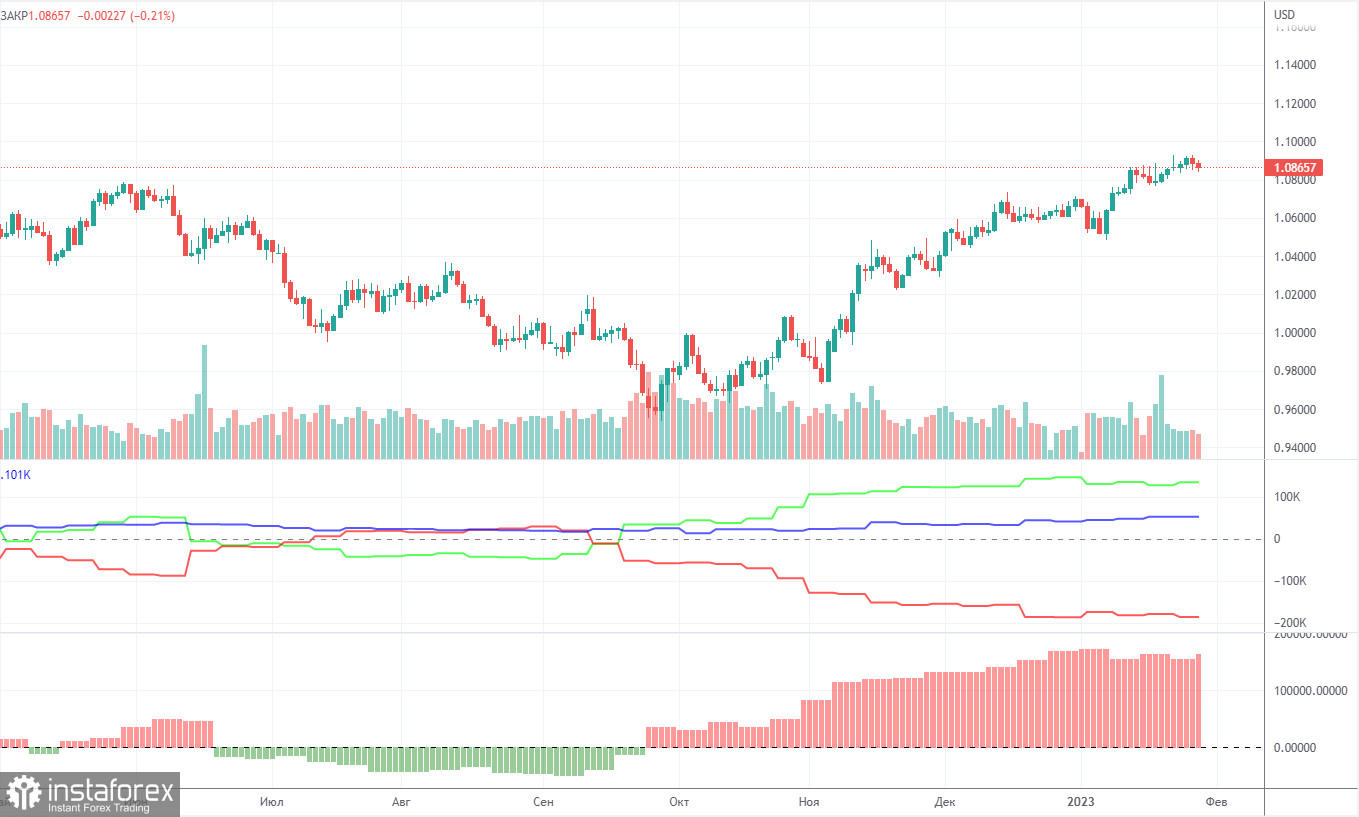
COT report
The COT reports on EUR/USD have been in line with expectations in recent months. The net non-commercial position has been on the rise since early September. The euro started to rise around the same time. The bullish non-commercial position rises with each new week. Taking into account this fact, we may assume that the uptrend will soon come to an end. The red and green lines of the first indicator are far apart, which is usually a sign of the end of a trend. In the reporting week, non-commercial traders opened 9,500 long positions and 2,000 short ones. The net non-commercial position grew by 7,500. The number of long positions exceeds that of short ones by 134,000. There were no new COT reports in the last two weeks, and it's difficult to explain the cause exactly. So now we have to work with the data we have at our disposal. The correction was formed for a long time anyway, so it's clear even without the reports that the pair should continue falling.
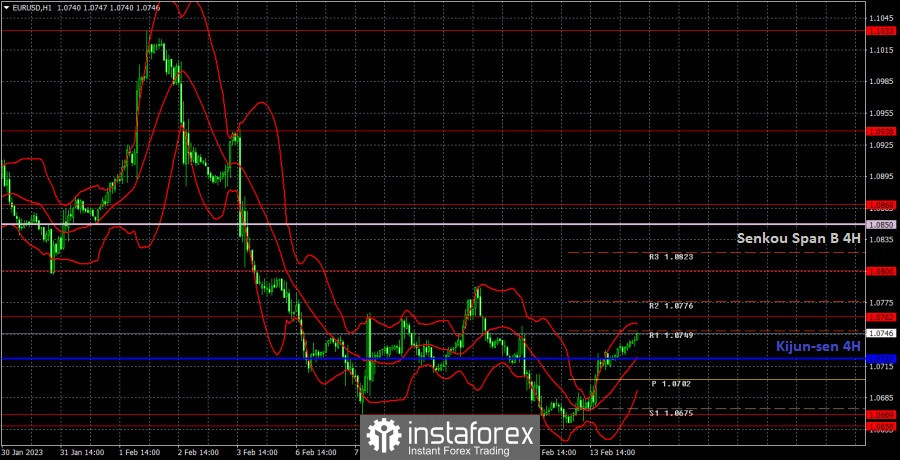
H1 chart of EUR/USD

On the one-hour chart, EUR/USD remains bearish despite overcoming the critical line. The Senkou Span B line is stronger, so the bulls won't find it easy to overcome it. The euro still has no reason to rise, so I think the euro will eventually fall this week. The US inflation report, which will be released today, might provoke the strengthening of the dollar, if it turns out to be weak. On Tuesday, important levels are seen at: 1.0485, 1.0581, 1.0658-1.0669, 1.0762, 1.0806, 1.0868, 1.0938, as well as the Senkou Span B (1.0850) and Kijun Sen (1.0722). Lines of the Ichimoku indicator may move during the day, which should be taken into account when determining trading signals. There are also support and resistance levels, but signals are not formed near these levels. Bounces and breakouts of the extreme levels and lines could act as signals. Don't forget about stop-loss orders, if the price covers 15 pips in the right direction. This will prevent you from losses in case of a false signal. On February 14, there will also be interesting events in the EU, there's the GDP report for the fourth quarter. It will be the second estimate, so I don't expect a strong reaction. Nonetheless, the report itself signals the state of the economy so its worth looking into.
What we see on the trading charts:
Price levels of support and resistance are thick red lines, near which the movement may end. They do not provide trading signals.
The Kijun-sen and Senkou Span B lines are the lines of the Ichimoku indicator, moved to the one-hour chart from the 4-hour one. They are strong lines.
Extreme levels are thin red lines from which the price bounced earlier. They provide trading signals.
Yellow lines are trend lines, trend channels, and any other technical patterns.
Indicator 1 on the COT charts reflects the net position size of each category of traders.
Indicator 2 on the COT charts reflects the net position size for the non-commercial group
Relevance up to 08:00 2023-02-15 UTC+1 This information is provided to retail and professional clients as part of marketing communication. It does not contain and should not be construed as containing investment advice or investment recommendation or an offer or solicitation to engage in any transaction or strategy in financial instruments. Past performance is not a guarantee or prediction of future performance. Instant Trading EU Ltd. makes no representation and assumes no liability as to the accuracy or completeness of the information provided, or any loss arising from any investment based on analysis, forecast or other information provided by an employee of the Company or otherwise. Full disclaimer is available here.
Read more: https://www.instaforex.eu/forex_analysis/335019