And again we’re having a look at the crude oil price charts as this commodity is really, really volatile especially in the past few days. As the charts (courtesy of TradingView.com) show, many of ceasefire rumours haven’t turned out to be true so the price of crude oil goes back to increasing every time.
As in the latest analysis we published some charts and express analysis, we should make a small update by getting to know how have the price fluctuated until today. Having said that, the monthly chart:
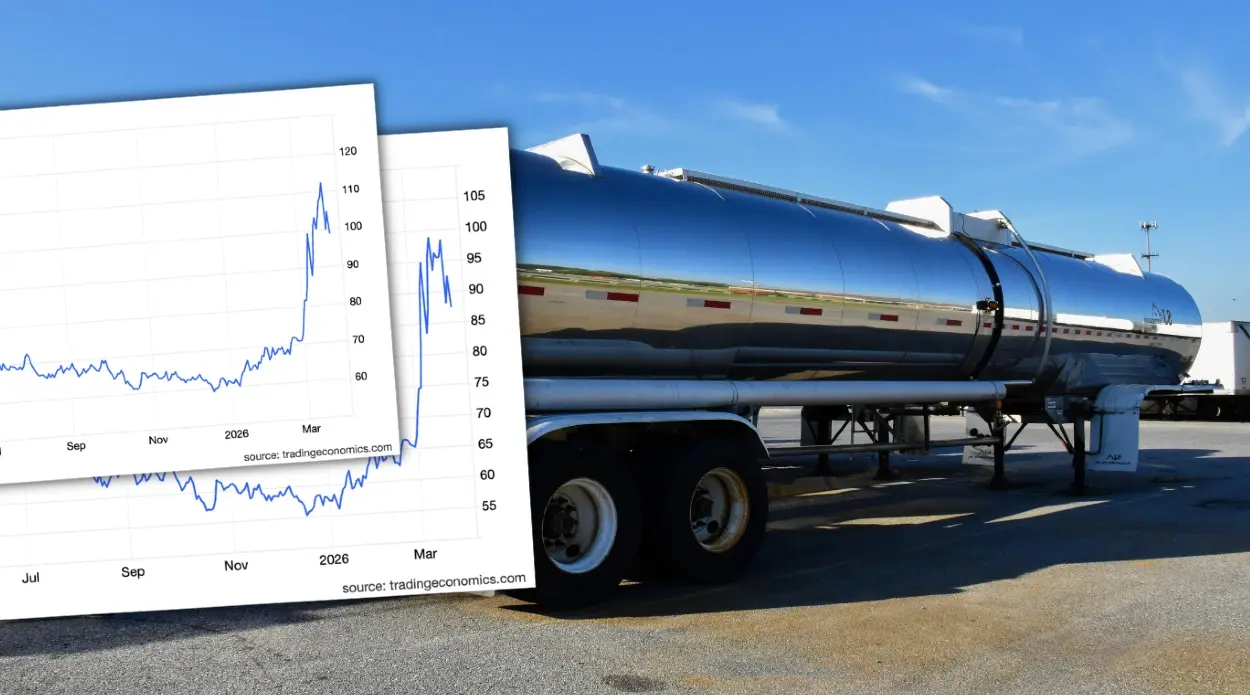
Crude Oil Price Chart – Monthly - 8% Up
The price line is like a very simplified drawing of all the events – countries’ leaders rhetoric, negotiations and today’s news about possible ceasefire.


Crude Oil Price Chart – Daily
As everybody knows there were some rumours that the there’s a possibility of further negotiations. However, mixed feelings remained as the news about the ceasefire are still unclear.
Data/Source: TradingView.com
Charts: courtesy of TradingView.com