
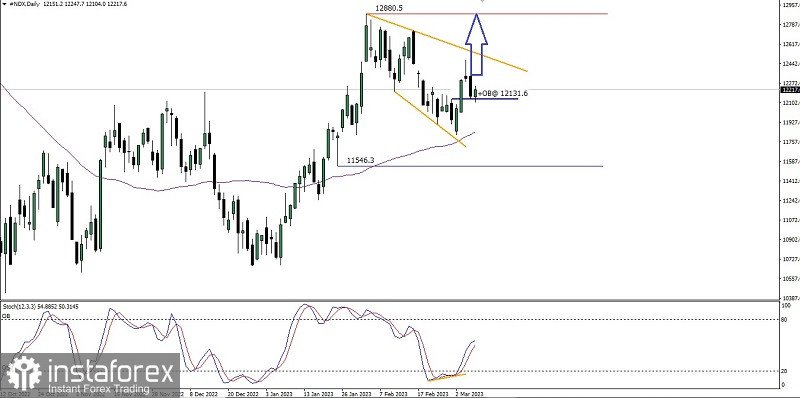
If we look at the daily chart of Nasdaq 100 Index then there will be a few interesting things:
1. The appearance of deviation between price movement with Stochastic Oscillator indicator.
2. Price movement which still moves above its MA 50.
3. The appearance of Bullish Continuation Descending Broadening Wedge pattern.
Based on those facts in a few days ahead, #NDX has the potential to appraciated upward up to the level 12880,5 particularly if the Bullish Orderblock level 12131,6 able to be a strong support level however if not, then please look at the level 11821,3 because if this level successfully broken downward then all the Bulls scenario that has been described before will become invalid and cancel by itself.
(Disclaimer)
Relevance up to 03:00 2023-03-12 UTC+1 This information is provided to retail and professional clients as part of marketing communication. It does not contain and should not be construed as containing investment advice or investment recommendation or an offer or solicitation to engage in any transaction or strategy in financial instruments. Past performance is not a guarantee or prediction of future performance. Instant Trading EU Ltd. makes no representation and assumes no liability as to the accuracy or completeness of the information provided, or any loss arising from any investment based on analysis, forecast or other information provided by an employee of the Company or otherwise. Full disclaimer is available here.
