

Since October, the dollar and its DXY index have been under pressure. Market participants expect a further slowdown in the Fed's monetary policy tightening. Many economists are already predicting the Fed will cut the size of the rate hike again in early 2023, moving to 0.25% hikes in February and March. And this is a harbinger of a deeper drop in DXY.
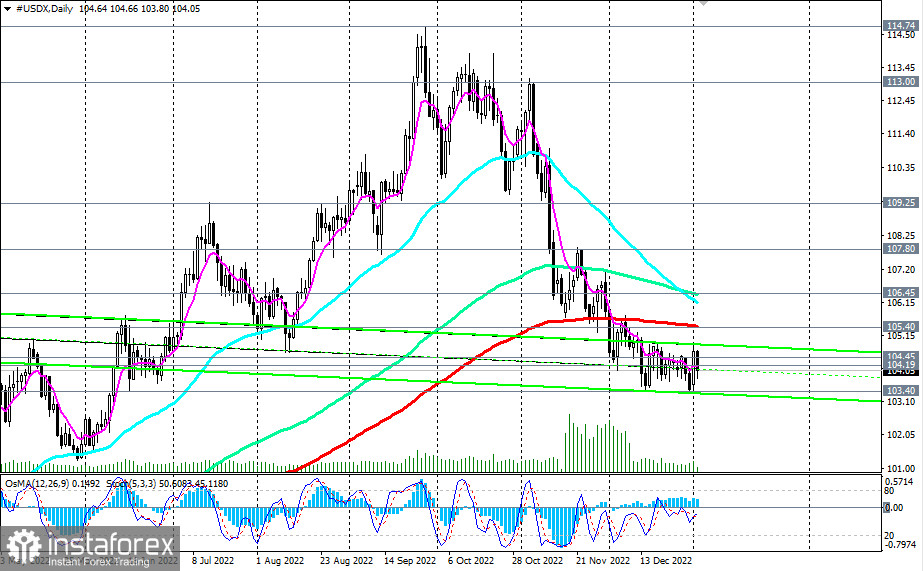
From a technical point of view, the dollar index (CFD #USDX in the MT4 trading terminal) is trading in the medium-term bear market zone, below the key resistance levels 105.40 (200 EMA on the daily chart), 104.45 (50 EMA on the weekly chart).
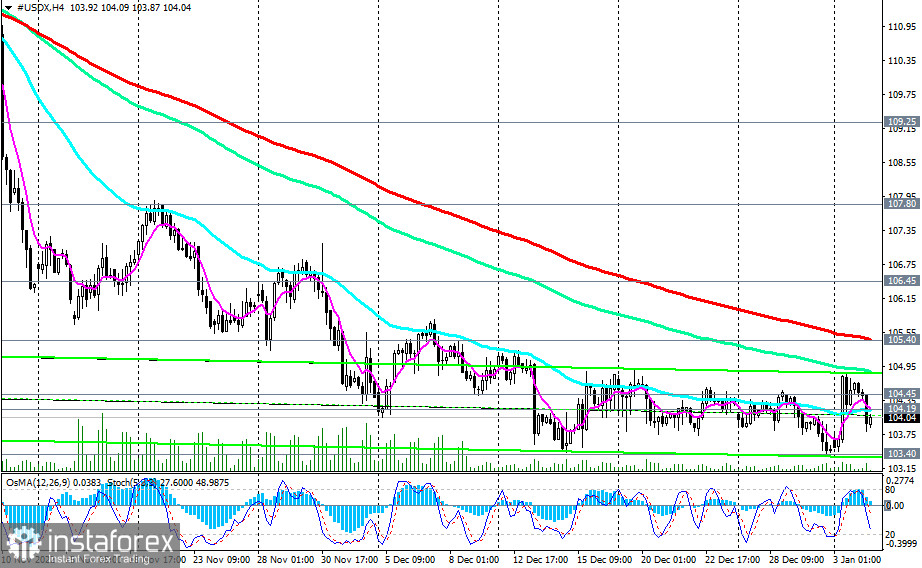
The first signal for building up short positions will be a breakdown of today's intraday low at 103.80, and a confirming one will be a breakdown of last month's low at 103.36. Long-term DXY downside targets are near 100.00, 98.55 (200 EMA on the weekly chart). In turn, the breakdown of the 93.00 support level (200 EMA on the monthly chart) will mark the breaking of the global bullish trend.
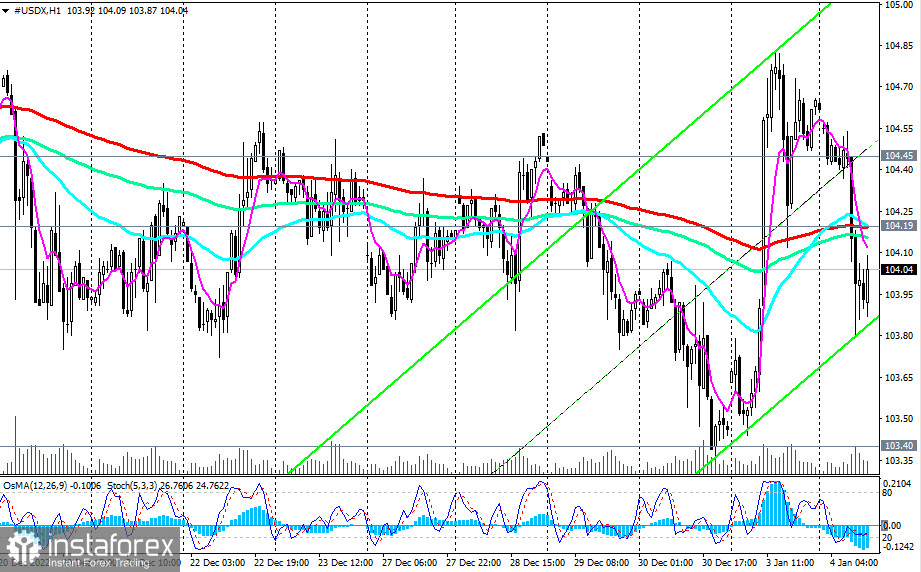
In the alternative scenario, the DXY will resume growth, returning to the bull market zone, above the 105.40 resistance level. The first signals for the implementation of this scenario will be the breakdown of the resistance levels 104.19 (200 EMA on the 1-hour chart), 104.45.
The breakdown of the 106.45 resistance level (144 EMA on the daily chart) will confirm the scenario of the resumption of growth in DXY.
In the meantime, short positions remain preferable even below the resistance levels 104.45, 104.19.
Support levels: 103.80, 103.40, 103.00, 102.00, 101.00, 100.00, 98.55, 93.00
Resistance levels: 104.19, 104.45, 105.40, 106.45, 107.80, 109.25
Trading Tips
Dollar Index CFD #USDX: Sell Stop 103.70. Stop Loss 104.90. Take-Profit 103.40, 103.00, 102.00, 101.00, 100.00, 98.55, 93.00
Buy Stop 104.90. Stop-Loss 103.70. Take-Profit 105.40, 106.45, 107.80, 109.25
Relevance up to 13:00 2023-01-07 UTC+1 Company does not offer investment advice and the analysis performed does not guarantee results. The market analysis posted here is meant to increase your awareness, but not to give instructions to make a trade.
