
USD/JPY:
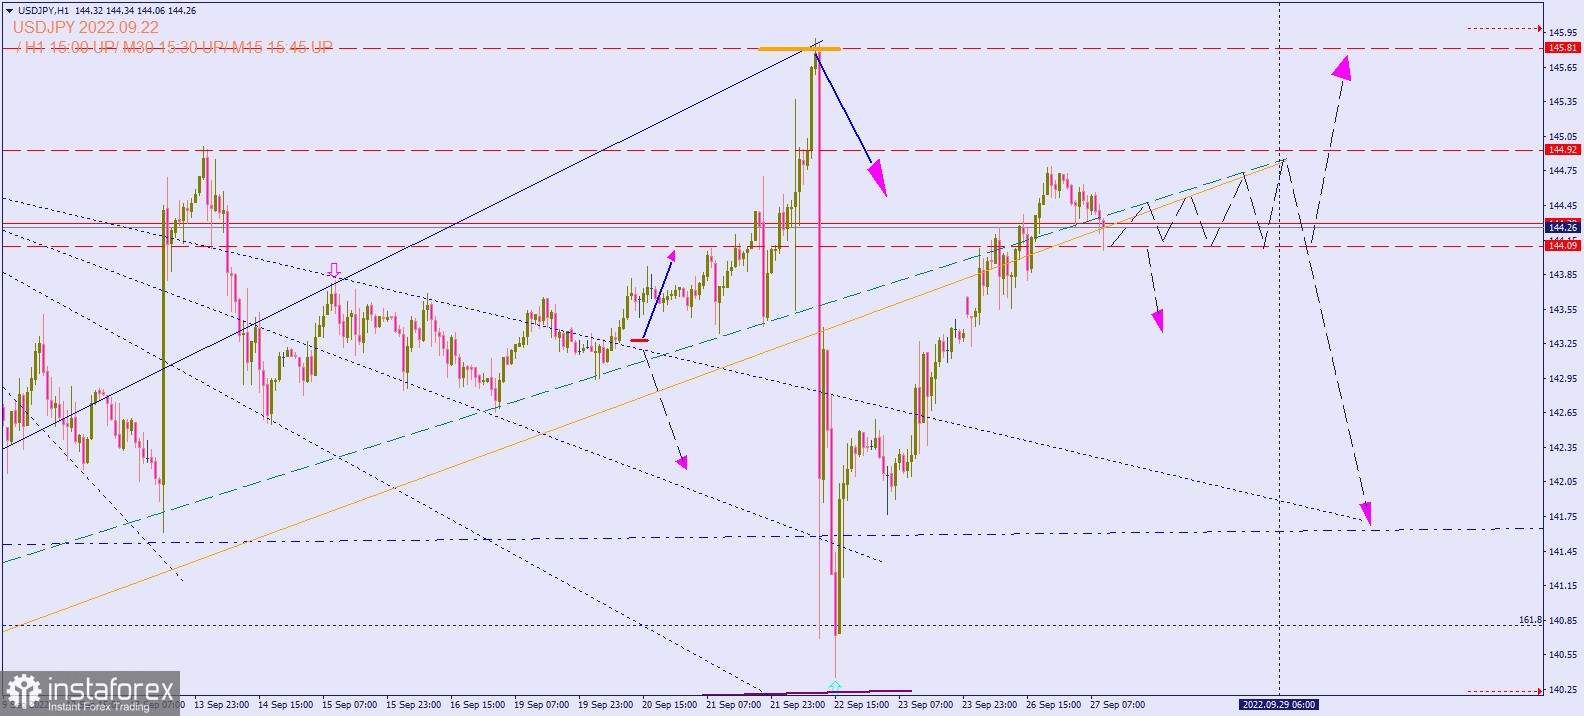
The chart shows the movement of #USD/JPY in the hourly (H1) chart.
Comparing the recent price movement to that of September 20 and 22's, it can be seen clearly that the key support level is £144.09, while the dynamic resistance levels are the two sloping lines converging on September 29's high, that is, £144.92.
Based on this, it is likely that a breakdown of the support level of £144.09 will lead to a drop towards £141.60, while a test and breakdown of £144.92 will result in a rise to £145.81. Either way, trading in the short-term is very risky, so be careful when entering and exiting the market.
Good luck!
Relevance up to 10:00 2022-09-28 UTC+2 Company does not offer investment advice and the analysis performed does not guarantee results. The market analysis posted here is meant to increase your awareness, but not to give instructions to make a trade.
