This Week Might Not Be So Rosy For The Pound (GBP)

On Tuesday, GBP/USD also showed a rapid upward movement of 160 pips in half an hour. Then, of course, the pullback started, and the pound's growth was triggered, as it is easy to guess, by the US inflation report, which fell more than forecasted. There is nothing more to analyze yesterday. Although Britain also released two reports in the morning, which the market simply ignored. The unemployment rate in Great Britain rose to 3.7%, and the average wages including bonuses rose by 6.1%. Both the first and second reports were fully in line with forecasts. Thus, the pound maintains its uptrend, positioning above the lines of the Ichimoku indicator of the 4-hour chart.
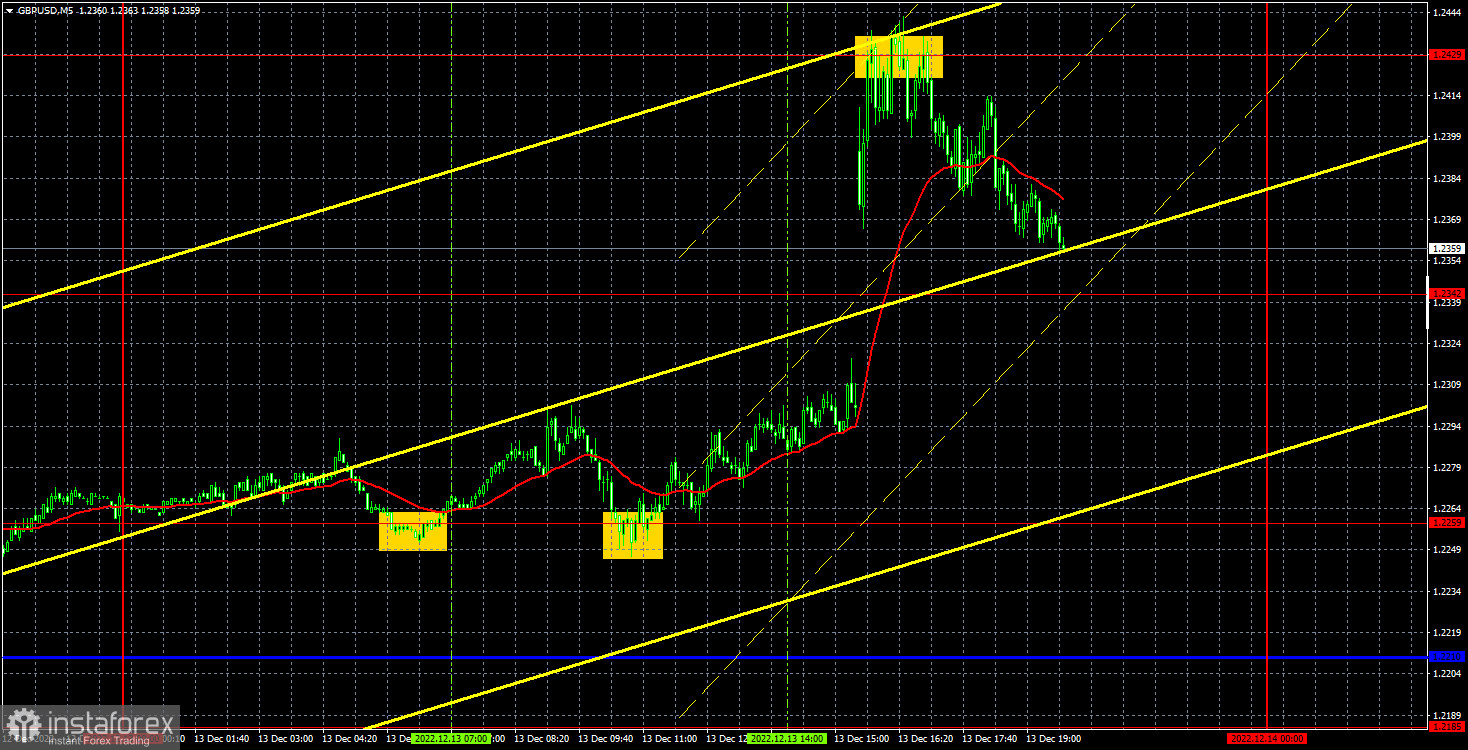
If the euro's trading signals were bad, then the pound's signals were excellent. There were two buy signals near 1.2259 during the European trading session. The first one was closed by Stop Loss without losing anything, as the price quickly returned to its initial positions. In the second case, traders managed to place the Stop Loss to Breakeven, and the pair rushed up after the US inflation report. It stopped only near 1.2429, from which it made a very eloquent rebound. At this point we should have closed the long positions (140 pips profit) and opened the shorts. The sell signal also turned out to be profitable, as the price fell almost to 1.2342. The deal should have been closed manually, the profit was about 40 pips. Therefore, the day turned out to be very successful.
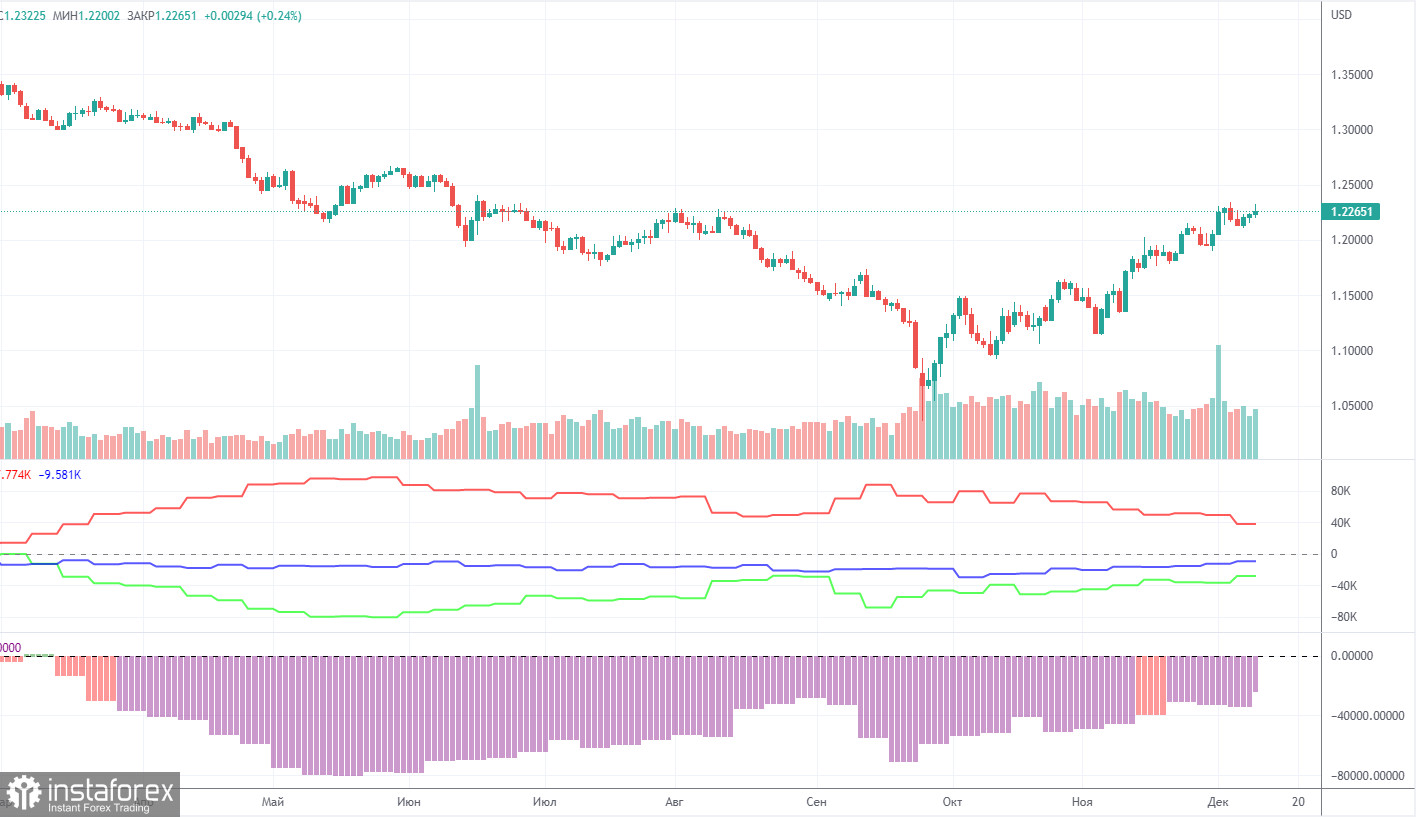
The latest COT report on the British pound showed that the bearish mood is weakening. During the reporting week, non-commercial traders opened 1,700 long positions and closed 7,800 short ones. The net position increased by almost 10,000. The net position dropped by 1,000. The figure has been on the rise for several months. Nevertheless, sentiment remains bearish, and the pound is on the rise against the greenback for no reason. We assume that the pair may well resume the downtrend soon. Notably, both GBP/USD and EUR/USD now show practically identical movement. At the same time, the net position on EUR/USD is positive and negative on GBP/USD. Non-commercial traders now hold 54,000 sell positions and 30,000 long ones. The gap between them is quite wide. As for the total number of open longs and shorts, the bulls have an advantage here by 10,000. Technical factors indicate that the pound may move in an uptrend in the long term. At the same time, fundamental and geopolitical factors signal that the currency is unlikely to strengthen significantly.
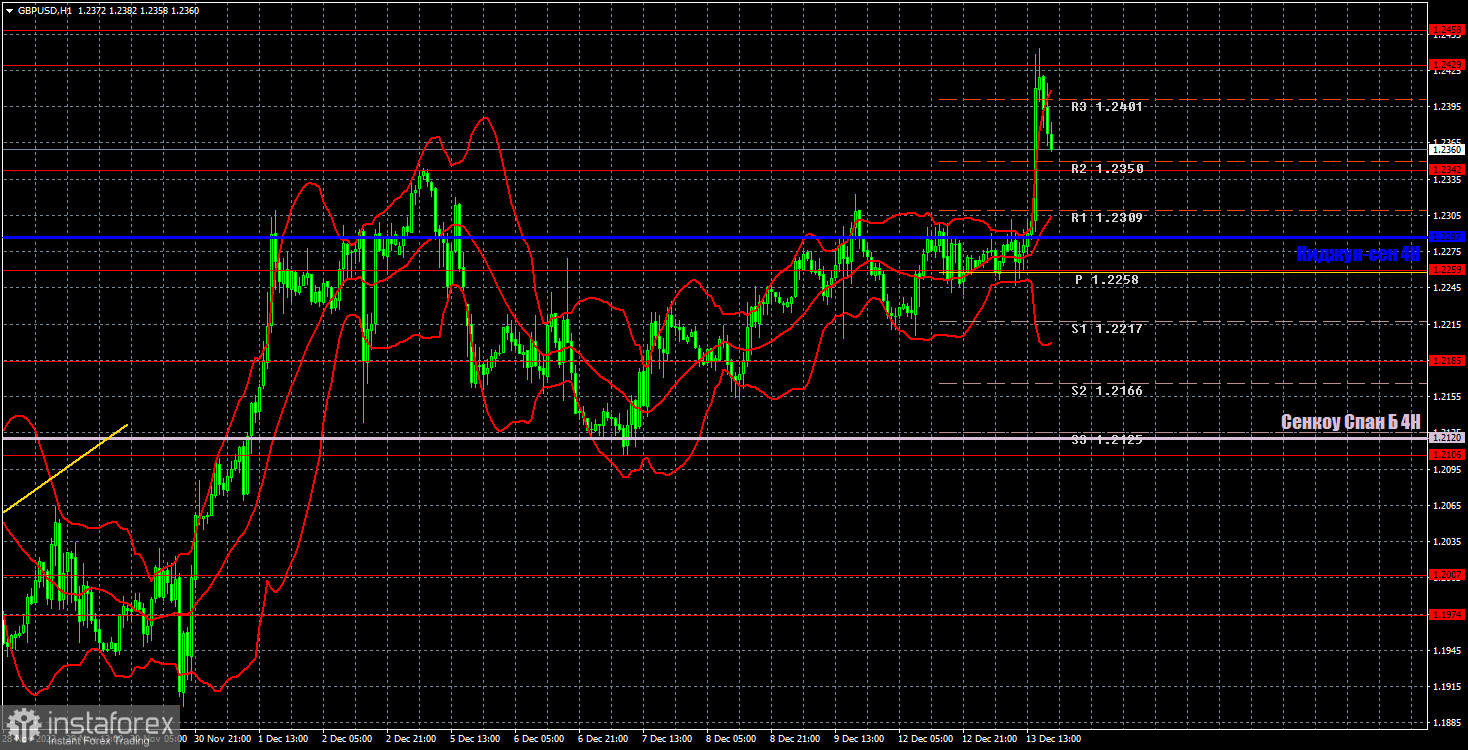
GBP/USD continues to trade higher on the one-hour chart, and it also received support from the US inflation report. However, this week might not be so rosy for the pound, as two central bank meetings might provoke totally unpredictable reactions. Remember that everything depends on what decisions central banks will take and what their heads will say at the press-conference. On Wednesday, the pair may trade at the following levels: 1.2106, 1.32185, 1.2259, 1.2342, 1.2429-1.2458, 1.2589, 1.2659. The Senkou Span B (1.2121) and Kijun Sen (1.2287) lines may also generate signals. Pullbacks and breakouts through these lines may produce signals as well. A Stop Loss order should be set at the breakeven point after the price passes 20 pips in the right direction. Ichimoku indicator lines may move during the day, which should be taken into account when determining trading signals. In addition, the chart does illustrate support and resistance levels, which could be used to lock in profits. On Wednesday, the UK is set to publish its inflation report, which might be very interesting as well. In the US, the key event of the week is the outcome of the Federal Reserve meeting, the last one this year, and the press conference with Fed Chairman Jerome Powell.
Price levels of support and resistance are thick red lines, near which the movement may end. They do not provide trading signals.
The Kijun-sen and Senkou Span B lines are the lines of the Ichimoku indicator, moved to the one-hour chart from the 4-hour one. They are strong lines.
Extreme levels are thin red lines from which the price bounced earlier. They provide trading signals.
Yellow lines are trend lines, trend channels, and any other technical patterns.
Indicator 1 on the COT charts reflects the net position size of each category of traders.
Indicator 2 on the COT charts reflects the net position size for the non-commercial group
Relevance up to 01:00 2022-12-15 UTC+1 Company does not offer investment advice and the analysis performed does not guarantee results. The market analysis posted here is meant to increase your awareness, but not to give instructions to make a trade.
