The UK IS Hoped For A Slowdown In Inflation In 2023

On Tuesday, no correction occurred and GBP/USD was bullish throughout the day. Technically, there were reasons for the rise. Interestingly, the market interprets fundamental and macroeconomic data in its own unique way. Thus, the UK delivered statistics on unemployment and wages. The UK jobless rate remained unchanged and held steady at 3.7%, and wages grew slightly faster than expected. In other words, there were no reasons for buying the pair. Later, BoE Governor Andrew Bailey delivered a speech. He said he hoped for a slowdown in inflation in 2023 as energy prices went down. As a reminder, inflation growth was partially caused by higher oil and gas prices in 2022. This means that there is a high probability of a slowing in the pace of rate hikes. So, how can it be good for the pound? The tone of Bailey's speech was in no way hawkish. Moreover, he said nothing about monetary policy or interest rates at all. However, the market decided otherwise.
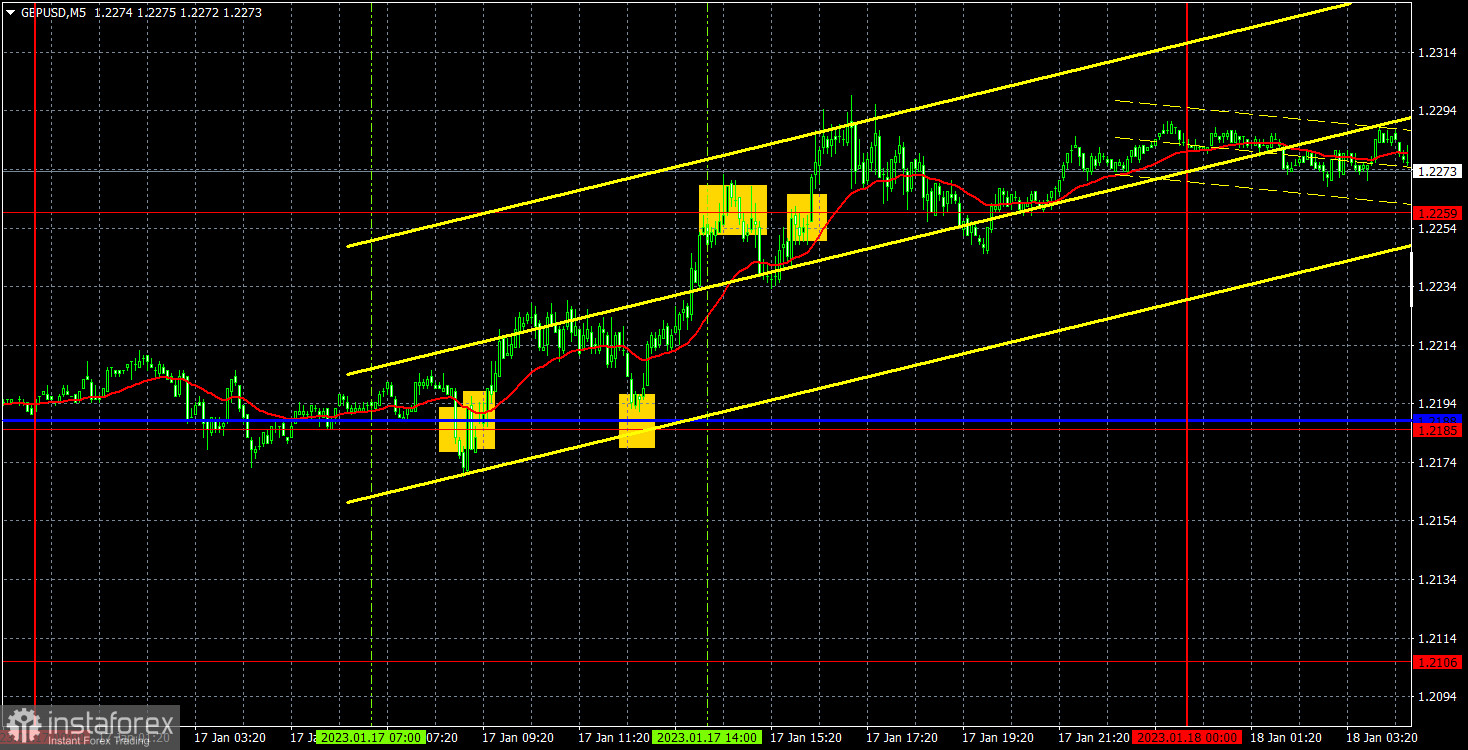
Tuesday kicked off with a false buy signal at around 1.2185. In half an hour, the price settled above this level. Traders incurred losses of some 30 pips and were able to open long positions. The price rose to 1.2259 but pulled back, generating a sell signal. Therefore, traders closed long positions with a profit of about 30 pips and opened short positions. Another sell signal was false, and traders incurred losses of 30 pips. The final buy signal would bring a profit of some 10-15 pips if the upward move did not stop by then.
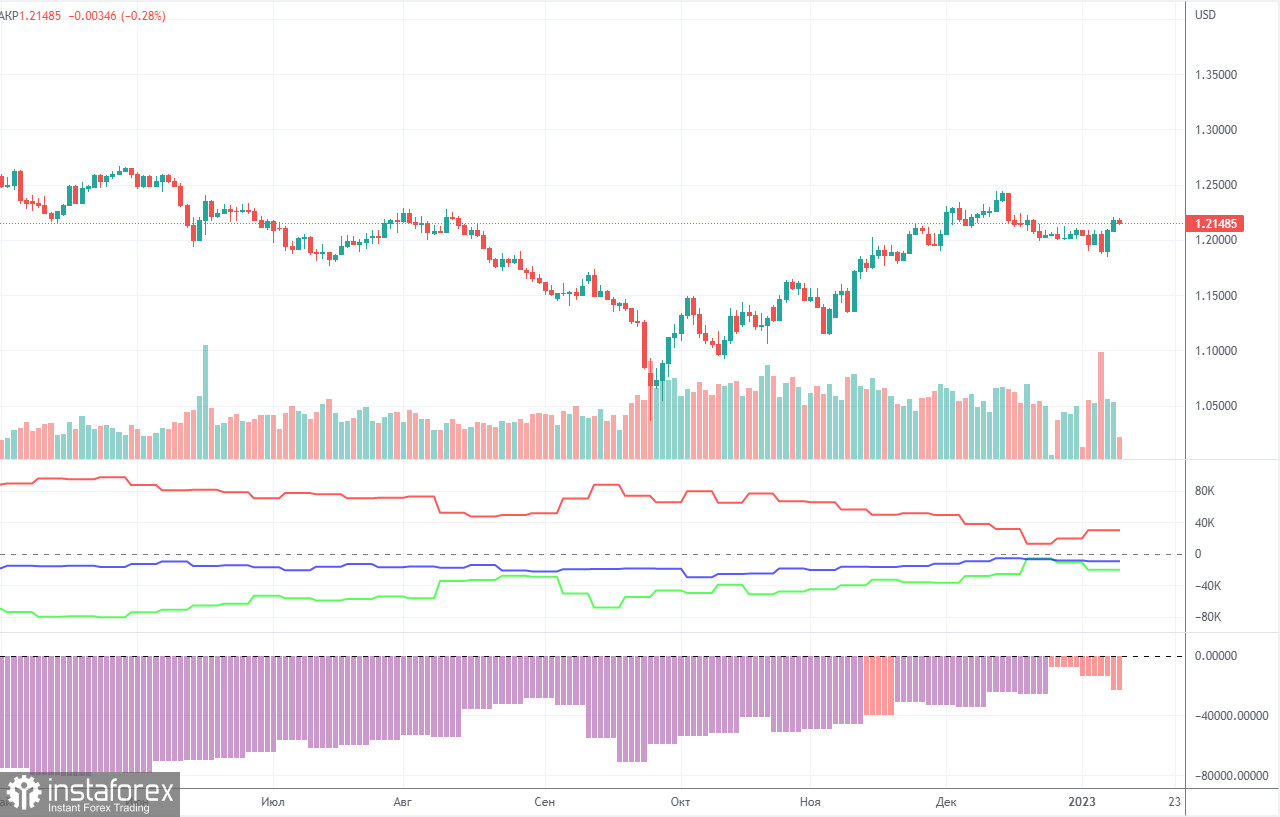
The latest COT report showed an increase in bearish sentiment. In a week, non-commercial traders closed 7,600 longs and opened 1,500 shorts. The net non-commercial position fell by 9,100. The net non-commercial position has been on the rise in recent months. However, sentiment has not turned bullish yet. Although the pound sterling has been bullish against the greenback in recent months, its growth can hardly be explained in terms of a fundamental point of view. We should not rule out the possibility that the pound may fall against the dollar in the medium term. There is still the need for a continuation of the corrective move in the market. Overall, the latest COT reports have been in line with the pair's movement. Since the net position is not bullish yet, a buying spree may go on for several months more. Non-commercial traders now hold 36,000 long positions and 65,500 short ones. We are still skeptical about the pair being bullish in the long term although there are technical reasons for that. However, in terms of fundamentals and geopolitics, this will unlikely be a strong and fast uptrend.
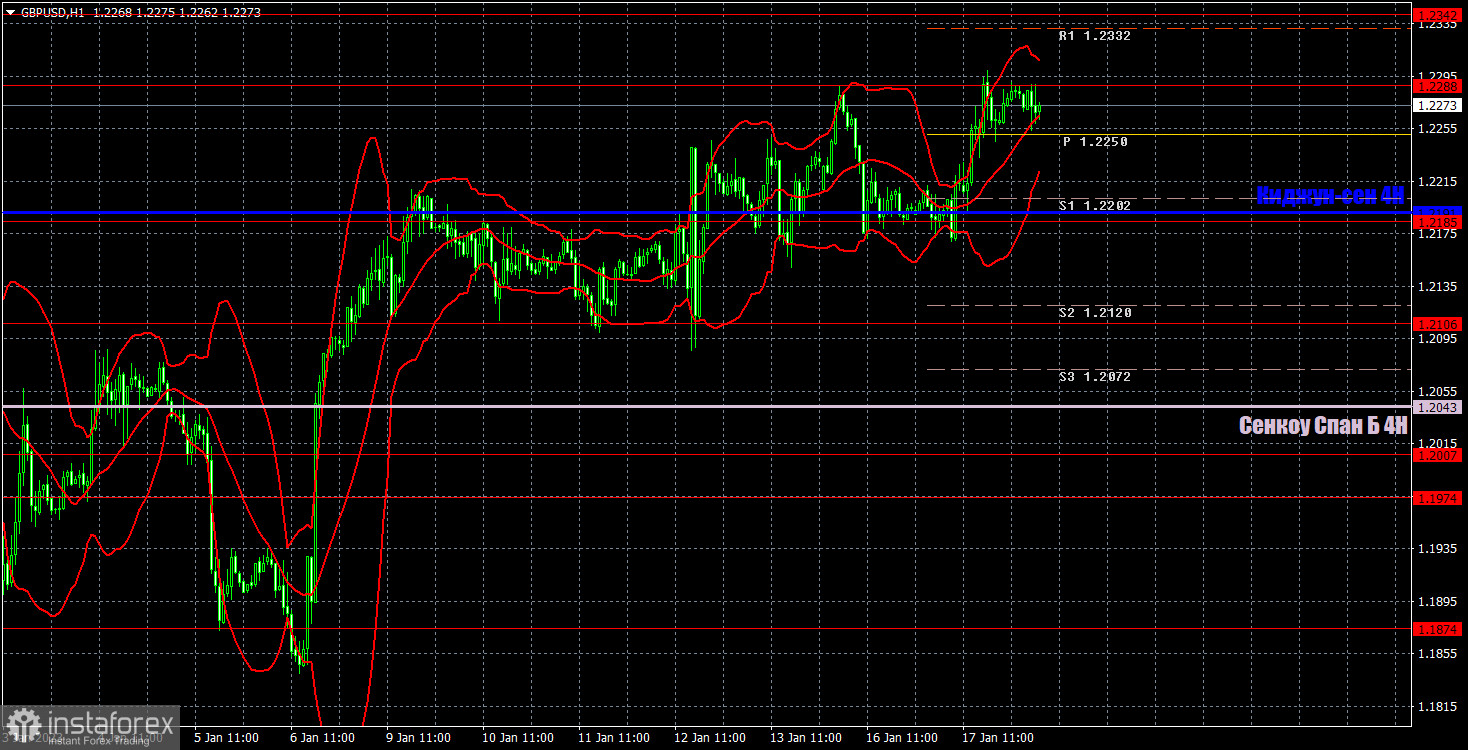
In the H1 time frame, GBP/USD keeps rising above the Ichimoku line. There have been not enough reasons for growth, but the pound has already gained 2,100 pips in recent months. On January 18, important levels are seen at 1.1974-1.2007, 1.2106, 1.2185, 1.2288, 1.2342, 1.2429-1.2458, and 1.2589. Senkou Span B (1.2043) and Kijun-sen (1.2191) may also generate signals. Don't forget to place a stop-loss order at the breakeven point when the price passes 20 pips in the right direction. Ichimoku indicator lines can move during the day, which should be taken into account when determining trading signals. There are also support and resistance although no signals are made near these levels, which can be used for locking in profits. On Wednesday, the UK will see the release of its inflation report for December. In the US, several minor reports will be delivered. In addition, some Fed officials will give interviews. All in all, they may also affect the price.
Resistance/support - thick red lines, near which the trend may stop. They do not make trading signals.
The Kijun-sen and Senkou Span B lines are the Ichimoku indicator lines moved to the hourly timeframe from the 4-hour timeframe. They are also strong lines.
Extreme levels are thin red lines, from which the price used to bounce earlier. They can produce trading signals.
Yellow lines are trend lines, trend channels, and any other technical patterns.
Indicator 1 on the COT chart is the size of the net position of each trader category.
Indicator 2 on the COT chart is the size of the net position for the Non-commercial group of traders
Relevance up to 06:00 2023-01-19 UTC+1 Company does not offer investment advice and the analysis performed does not guarantee results. The market analysis posted here is meant to increase your awareness, but not to give instructions to make a trade
Read more: https://www.instaforex.eu/forex_analysis/332578
