The GBP/USD Pair Is Still Trading In An Uptrend


GBP/USD also traded mostly sideways on Friday, and it's still trading the same way at the beginning of the new week. At the moment, the pound returned to its local high near 1.2429, but has not yet managed to overcome it. Thus, further growth is still questionable, but given the predisposition of the market to buy euro and pound in recent weeks and months, I will not be surprised if it still rises this week. The market is already focused on the next Federal Reserve and Bank of England meetings and it looks like we shouldn't expect the Fed to be more aggressive, but the BoE with its highest inflation rate has no other way but to keep raising the rate aggressively. I don't think this is entirely true, as no one knows how much longer the BoE will be able to raise the rate. The recession in the British economy may be the longest and deepest among EU countries, but the fact remains that the market believes the BoE will continue to tighten monetary policy.
There were three buy signals on Friday. All of them were near 1.2342. The price rebounded from the specified level three times, but it was only able to go in the right direction by more than 20 points on the third time. Therefore, you should have only opened one long position. The pair was able to grow by about 35 pips until the evening, that's how much traders could get on this single deal by closing it manually.

The latest COT report showed an increase in bearish sentiment. During the given period, non-commercial traders closed 7,600 long positions and opened as many as 1,500 short positions. Thus, the net position fell by about 9,100. This figure has been on the rise for several months, and the sentiment may become bullish in the near future, but it hasn't yet. Although the pound has grown against the dollar for the last few months, from a fundamental perspective, it is difficult to answer why it keeps rising. On the other hand, it could fall in the near future (in the mid-term prospect) because it still needs a correction. In general, in recent months the COT reports correspond to the pound's movements so there shouldn't be any questions. Since the net position is not even bullish yet, traders may continue to buy the pair over the next few months. Non-commercial traders now hold 36,000 long positions and 65,500 short ones. I remain skeptical about the pound's long term growth, though there are technical reasons for it. At the same time, fundamental and geopolitical factors signal that the currency is unlikely to strengthen significantly.
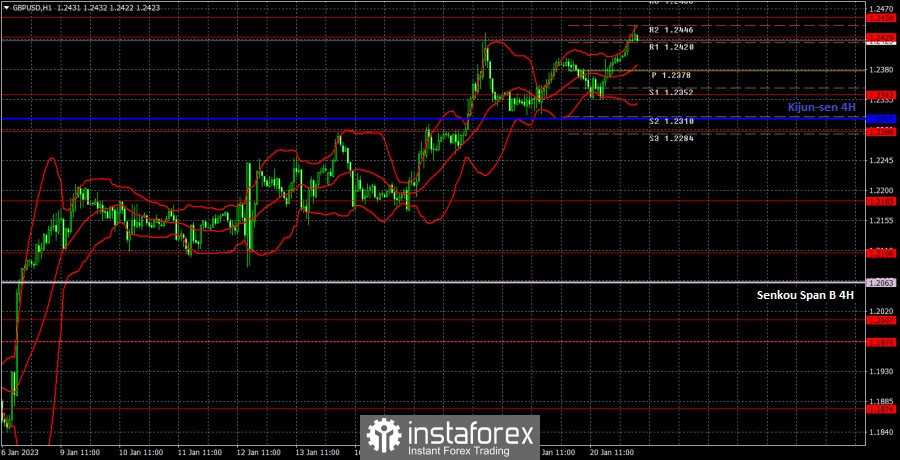
On the one-hour chart, GBP/USD is still trading in an uptrend and continues to be above the lines of the Ichimoku indicator. Thus, due to technical reasons, we can expect the pound to continue rising even if it is unreasonable. There are no sell signals, therefore, it is not necessary to expect a sharp fall from the pound. Do recall that the pound sharply rose in the last months and too quickly at that, therefore, it is considered overbought. But the market believes that buying without any clear reason is still possible, so the pair may continue rising this week. On January 23, the pair may trade at the following levels: 1.2106, 1.2185, 1.2259, 1.2342, 1.2429-1.2458, 1.2589, 1.2659. The Senkou Span B (1.2063) and Kijun Sen (1.2307) lines may also generate signals. Pullbacks and breakouts through these lines may produce signals as well. A Stop Loss order should be set at the breakeven point after the price passes 20 pips in the right direction. Ichimoku indicator lines may move during the day, which should be taken into account when determining trading signals. In addition, the chart does illustrate support and resistance levels, which could be used to lock in profits. On Monday, there are no important events planned in the US and Britain, but overnight trading already showed that the market is ready to buy the pair again, despite the lack of fresh fundamental and macroeconomic background.
Price levels of support and resistance are thick red lines, near which the movement may end. They do not provide trading signals.
The Kijun-sen and Senkou Span B lines are the lines of the Ichimoku indicator, moved to the one-hour chart from the 4-hour one. They are strong lines.
Extreme levels are thin red lines from which the price bounced earlier. They provide trading signals.
Yellow lines are trend lines, trend channels, and any other technical patterns.
Indicator 1 on the COT charts reflects the net position size of each category of traders.
Indicator 2 on the COT charts reflects the net position size for the non-commercial group
Relevance up to 05:00 2023-01-24 UTC+1 Company does not offer investment advice and the analysis performed does not guarantee results. The market analysis posted here is meant to increase your awareness, but not to give instructions to make a trade.
