The Euro (EUR) Is Moving Slowly To The Downside

EUR/USD was trading flat for most of the day, although we saw a bit of a downward bias. Thus, in general, everything goes according to plan. The euro is moving slowly to the downside, which we've been waiting for quite a long time. The macroeconomic and fundamental background is nearly absent, so it is very difficult to expect a strong movement now. Yesterday, the EU published its second estimate inflation report, which did not have any particular meaning or impact on market sentiment. It was the second estimate of the indicator for January. The same goes for GDP in the US, also the second estimate. With the overall volatility of the pair around 50 pips, it is hardly necessary to talk about any reaction of traders to these reports. Technically there is always a reaction, but who cares about 20 pips movement?
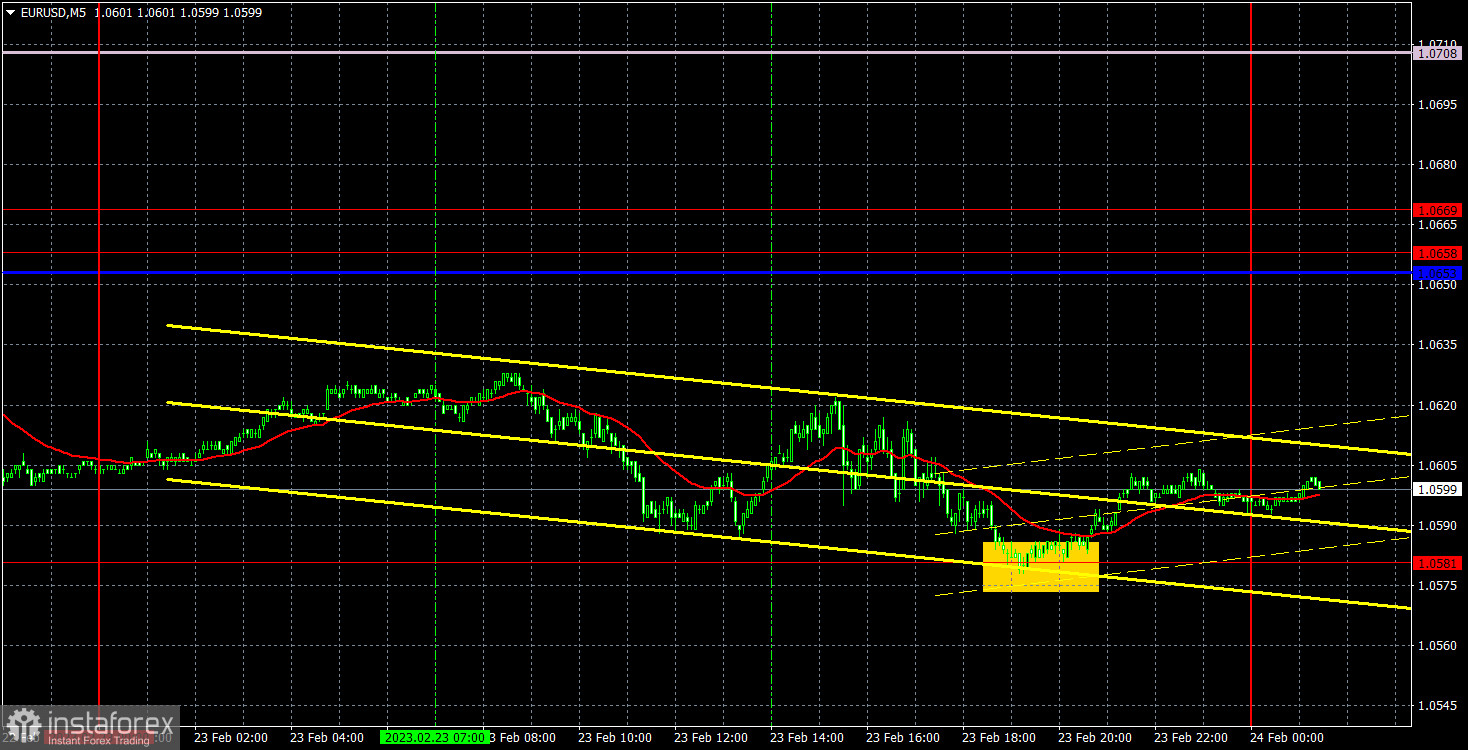
Speaking of trading signals, everything is still disappointing. The first trading signal was formed closer to the evening, when the price reached 1.0581. Naturally, there was no sense to work it out at night. Therefore, traders should not open positions on Thursday, if they are guided by our signals and tips. Such weak movements can persist for another week or two.

Due to a technical glitch, fresh COT reports have not been released since January 24. Therefore, we can only analyze reports published before this date. The COT reports on EUR/USD have been in line with expectations in recent months. The net non-commercial position has been on the rise since September. The bullish non-commercial position rises with each new week. Taking into account this fact, we may assume that the uptrend will soon come to an end. The red and green lines of the first indicator are far apart, which is usually a sign of the end of a trend. In the reporting week, non-commercial traders opened 9,500 long positions and 2,000 short ones. The net non-commercial position grew by 7,500. The number of long positions exceeds that of short ones by 134,000. In any case, a correction has been looming for a long time. Therefore, even without reports, it is clear that the downtrend will continue.
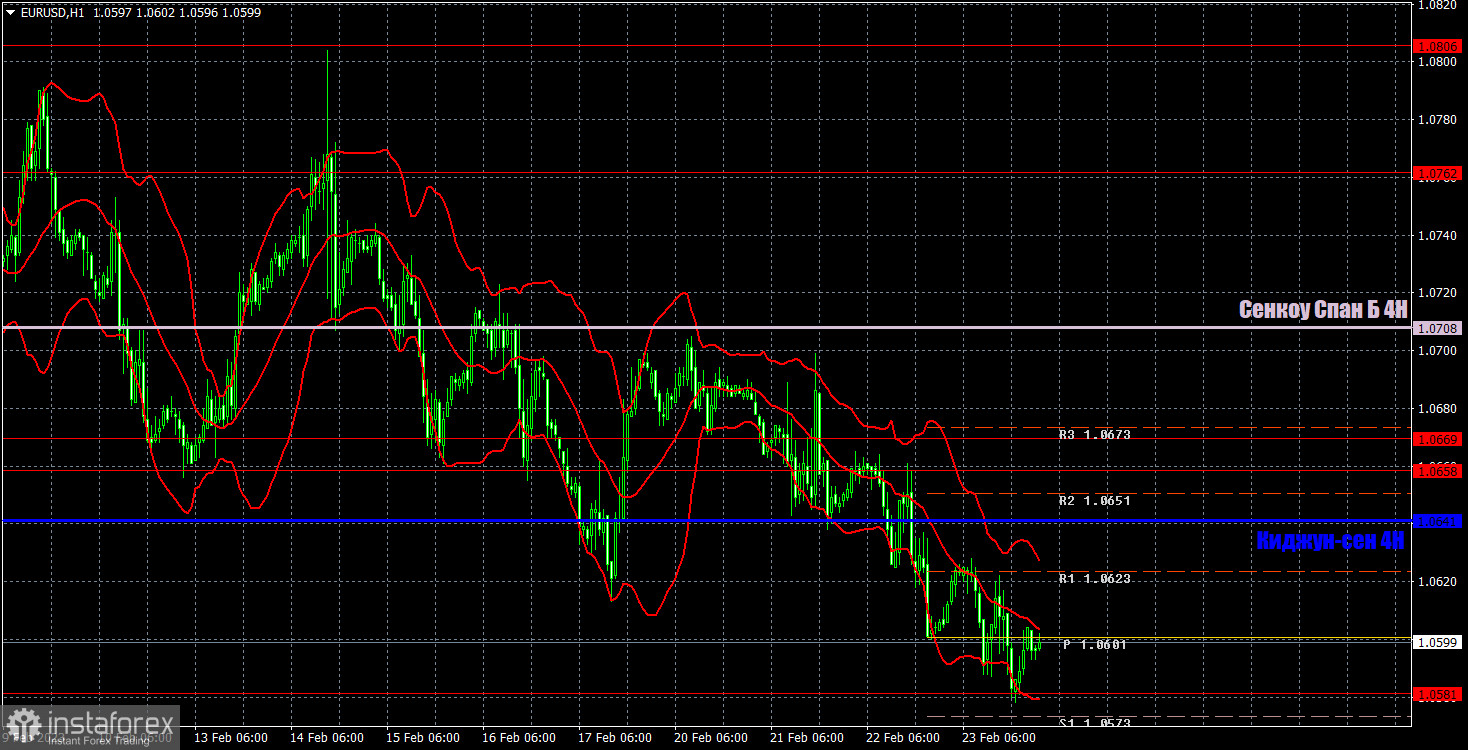
On the one-hour chart, the pair maintains the bearish mood and trades below the Ichimoku indicator lines. The downward movement is not strong, but at the same time it is stable. The movement is weak since there's almost no important events on the market now, so the pair is moving according to our forecasts, but it's still doing it too slowly. Formally, we have a trend, but it looks like a flat most of the time. On Friday, important levels are seen at 1.0340-1.0366, 1.0485, 1.0581, 1.0658-1.0669, 1.0762, and also Senkou Span B lines (1.0708) and Kijun Sen (1.0641). Ichimoku indicator lines can move intraday, which should be taken into account when determining trading signals. There are also support and resistance although no signals are made near these levels. They could be made when the price either breaks or rebounds from these extreme levels. Do not forget to place Stop Loss at the breakeven point when the price goes by 15 pips in the right direction. In case of a false breakout, it could save you from possible losses. On February 24, there are no important events planned in the European Union. In the US, we only have the Personal Income and Spending data and the University of Michigan Consumer Sentiment Index. Completely secondary reports that are unlikely to provoke any reaction.
Resistance/support - thick red lines, near which the trend may stop. They do not make trading signals.
Kijun-sen and Senkou Span B are the Ichimoku indicator lines moved to the hourly timeframe from the 4-hour timeframe. They are also strong lines.
Extreme levels are thin red lines, from which the price used to bounce earlier. They can produce trading signals.
Yellow lines are trend lines, trend channels, and any other technical patterns.
Indicator 1 on the COT chart is the size of the net position of each trader category.
Indicator 2 on the COT chart is the size of the net position for the Non-commercial group of traders.
Relevance up to 01:00 2023-02-25 UTC+1 This information is provided to retail and professional clients as part of marketing communication. It does not contain and should not be construed as containing investment advice or investment recommendation or an offer or solicitation to engage in any transaction or strategy in financial instruments. Past performance is not a guarantee or prediction of future performance. Instant Trading EU Ltd. makes no representation and assumes no liability as to the accuracy or completeness of the information provided, or any loss arising from any investment based on analysis, forecast or other information provided by an employee of the Company or otherwise. Full disclaimer is available here.
