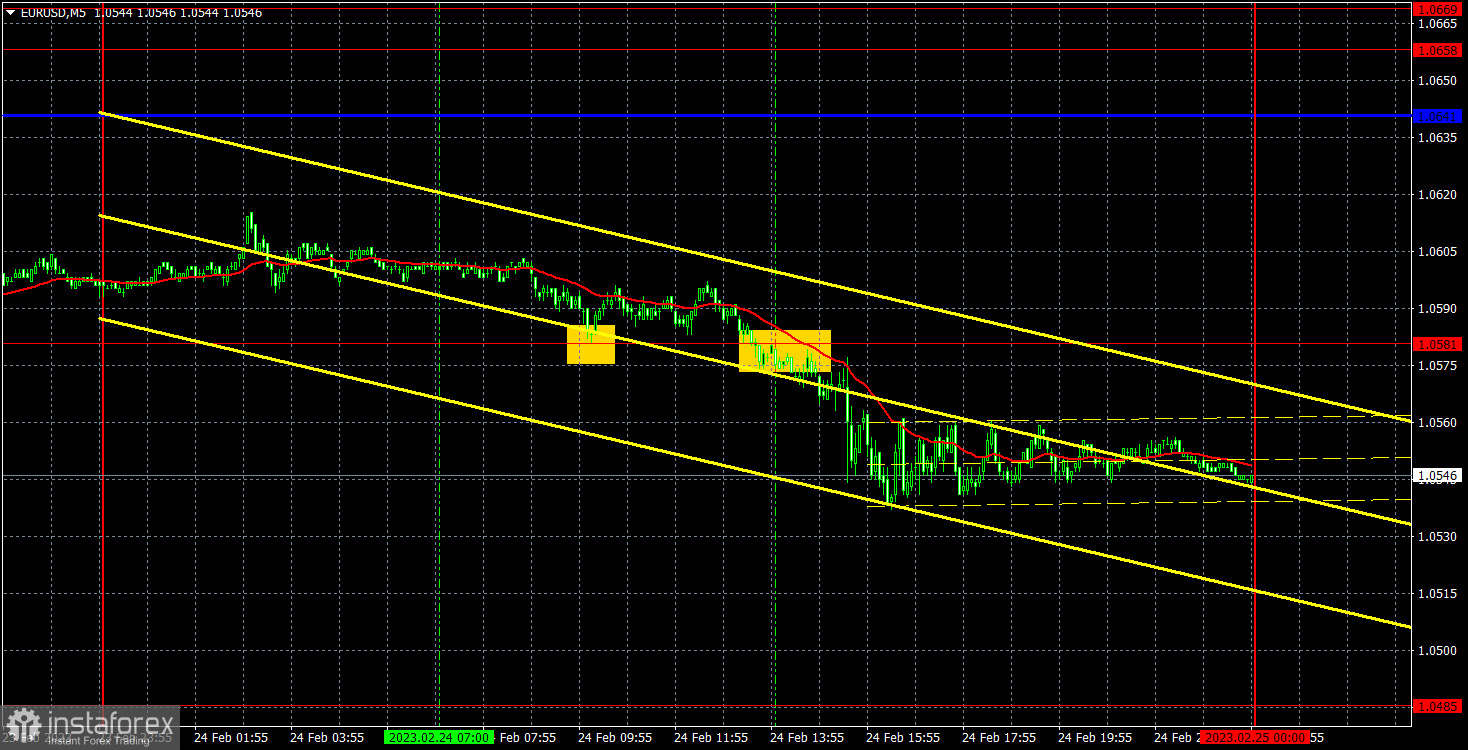
5M chart of EUR/USD
EUR/USD fell on Friday. It retained the bearish trend and was partly supported by the macroeconomic background in the second half of the day. At the same time, the Personal Income and Consumer Spending data was released in America, as well as the University of Michigan Consumer Sentiment Index. All three reports turned out to be better than expected, but the US dollar had started rising much earlier. So I think that the pair would have continued to fall anyway. As I have mentioned many times before, a decline is the most logical outcome right now, because the euro has been rising for a long time without any definite reason to do so. Now it's time for a correction, which the pair has been showing for several weeks. The farther into the forest, the more reasons to expect a deeper decline from the euro.
There were only two trading signals on Friday. First, the pair rebounded from 1.0581, but it failed to move up 15 pips, which would be enough to place the Stop Loss at Breakeven. Therefore, the long position closed with a loss of about 17 pips, when the pair settled below 1.0581. This sell signal could have been priced too, and this time the price passed in the right direction at least 20-30 pips, which traders could have gotten by closing the deal manually closer to the evening (there was no other option).
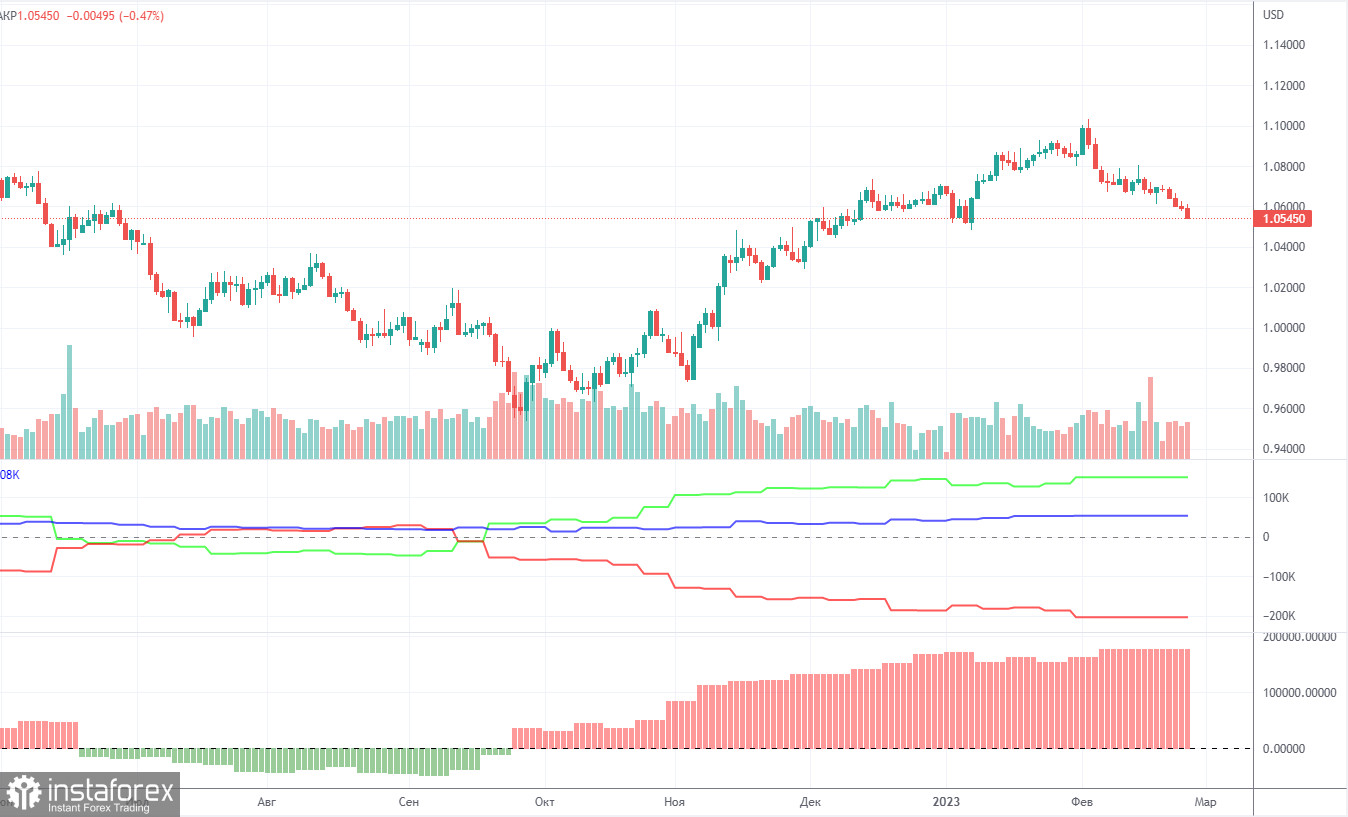
COT report:

Due to a technical glitch, new COT reports have not been released for almost a month, but on Friday, one of the reports for January 31 was released. This report does not make much sense, because since then, a month has passed, and the data from the next reports (which are more or less up-to-date) are still not available. Therefore, we will analyze the data that are available. The COT reports on EUR/USD have been in line with expectations in recent months. The net non-commercial position has been on the rise since September. Around the same time, the euro started to rise. The bullish non-commercial position rises with each new week. Taking into account this fact, we may assume that the uptrend will soon come to an end. The red and green lines of the first indicator are far apart, which is usually a sign of the end of a trend. The euro has already started to fall, but it is not clear yet, is it a pullback or a new downtrend? In the reporting week, non-commercial traders opened 9,000 long positions while the number of shorts decreased by 7,100. Correspondingly, the net position increased by 16,100. The number of long positions exceeds that of short ones by 148,000. In any case, a correction has been looming for a long time. Therefore, even without reports, it is clear that the downtrend will continue.
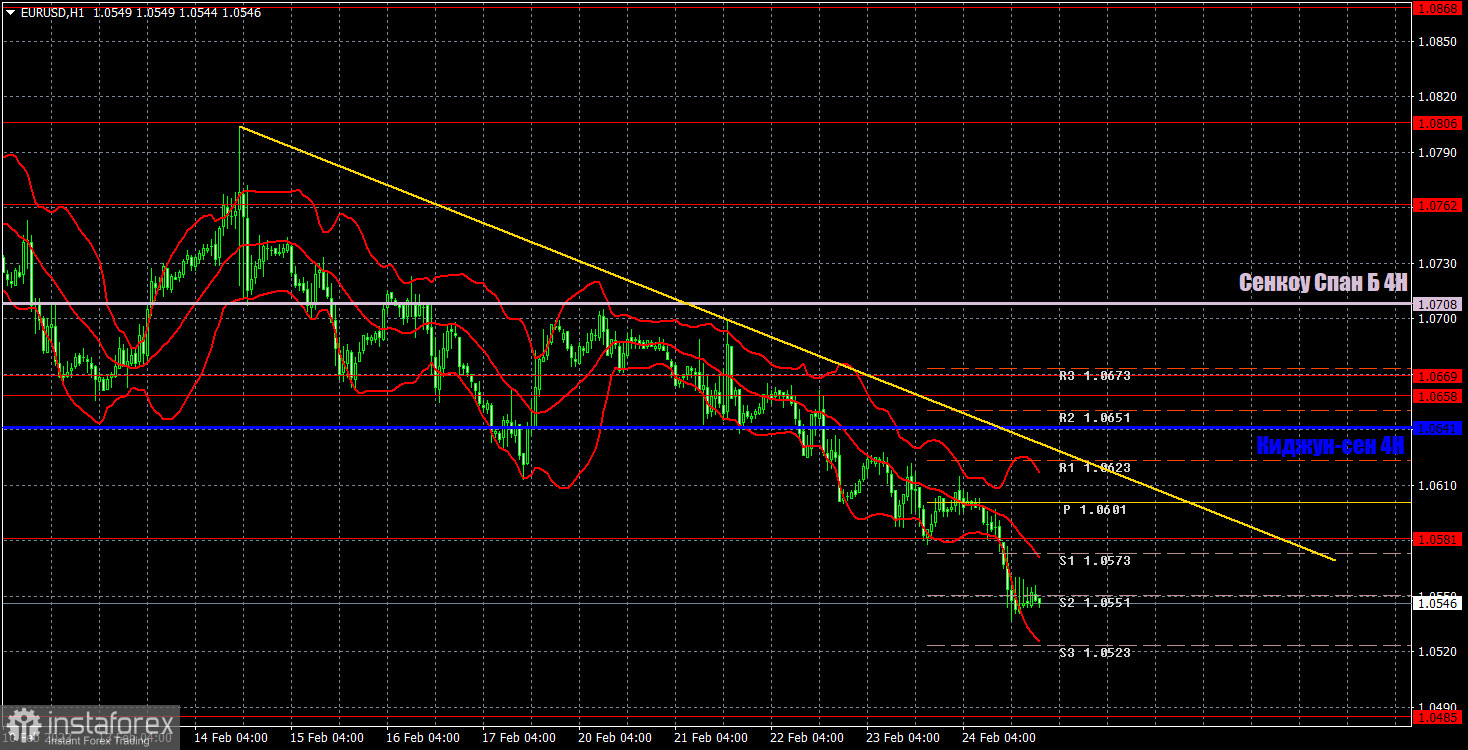
1H chart of EUR/USD
On the one-hour chart, the pair maintains the bearish mood and trades below the Ichimoku indicator lines. We also formed a descending trend line, consolidating above which will determine the end of the downtrend. However, for the time being, the pair might continue a slight but steady decline. On Monday, important levels are seen at 1.0340-1.0366, 1.0485, 1.0581, 1.0658-1.0669, 1.0762, as well as Senkou Span B (1.0708) and Kijun Sen (1.0641). Ichimoku indicator lines can move intraday, which should be taken into account when determining trading signals. There are also support and resistance although no signals are made near these levels. They could be made when the price either breaks or rebounds from these extreme levels. Do not forget to place Stop Loss at the breakeven point when the price goes by 15 pips in the right direction. In case of a false breakout, it could save you from possible losses. On February 27, no important reports or events are scheduled in the European Union. In the US, we will just receive a report on Durable Goods Orders which is unlikely to cause a strong reaction in the market. Monday is likely to be as dull as usual, but the pair may continue to move down due to the momentum.
Indicators on charts:
Resistance/support - thick red lines, near which the trend may stop. They do not make trading signals.
Kijun-sen and Senkou Span B are the Ichimoku indicator lines moved to the hourly timeframe from the 4-hour timeframe. They are also strong lines.
Extreme levels are thin red lines, from which the price used to bounce earlier. They can produce trading signals.
Yellow lines are trend lines, trend channels, and any other technical patterns.
Indicator 1 on the COT chart is the size of the net position of each trader category.
Indicator 2 on the COT chart is the size of the net position for the Non-commercial group of traders
Relevance up to 01:00 2023-02-28 UTC+1 This information is provided to retail and professional clients as part of marketing communication. It does not contain and should not be construed as containing investment advice or investment recommendation or an offer or solicitation to engage in any transaction or strategy in financial instruments. Past performance is not a guarantee or prediction of future performance. Instant Trading EU Ltd. makes no representation and assumes no liability as to the accuracy or completeness of the information provided, or any loss arising from any investment based on analysis, forecast or other information provided by an employee of the Company or otherwise. Full disclaimer is available here.
Read more: https://www.instaforex.eu/forex_analysis/336111