The EUR/USD Pair Maintains The Bearish Mood

EUR/USD traded higher on Monday. It was unexpected for many people, but in general, we just witnessed a standard growth, and as a result, the pair was near the critical line. The only report that traders could pay attention to was the Durable Goods Orders. European Central Bank President Christine Lagarde had an interview, but she did not mention anything that was particularly new, just reassured that the rate will continue to grow as part of the fight against high inflation. And the Durable Goods Orders report was weak enough for the dollar to hold its current positions. It did not. As a result, the pair rose about 70-80 pips.
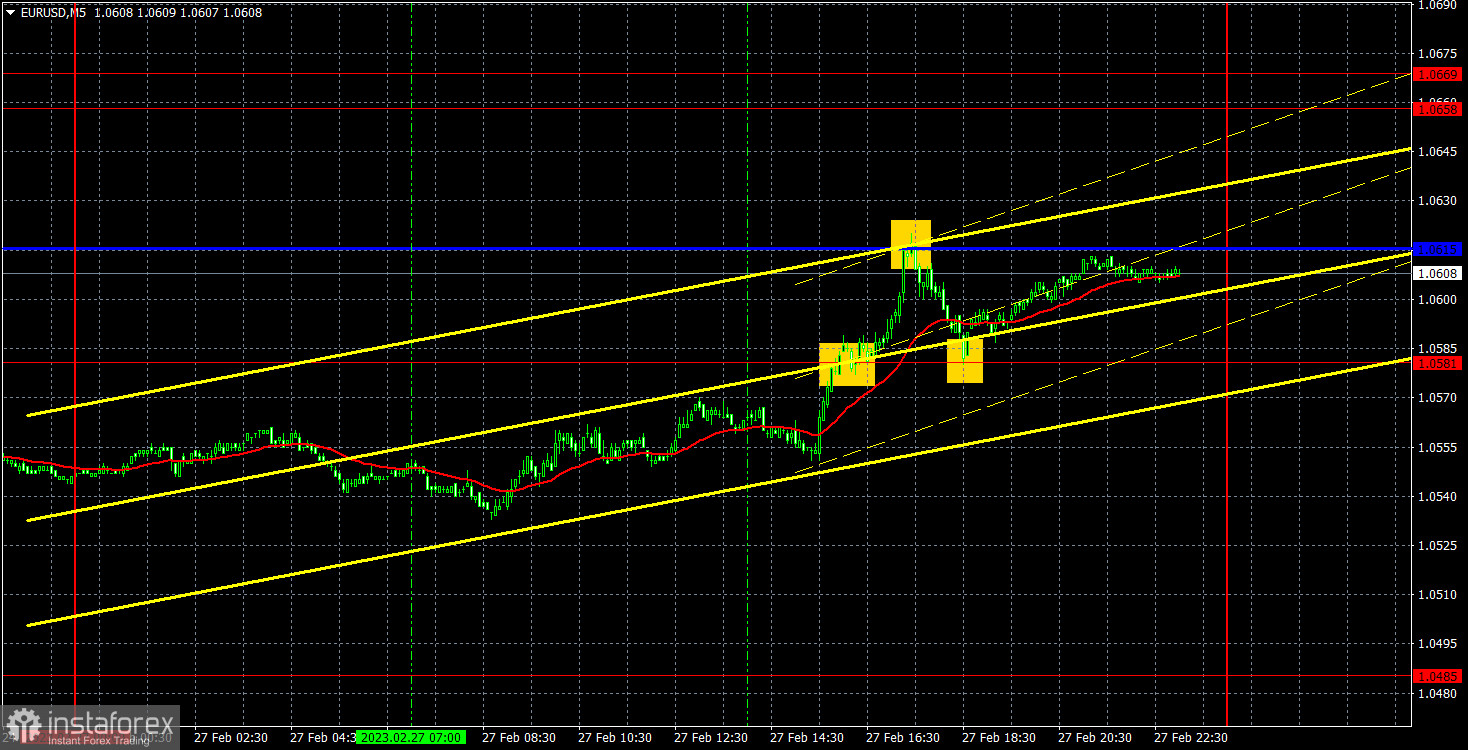
There were few trading signals on Monday. The first one was formed in the US session, when the pair broke through 1.0581. The Kijun-Sen line was very near, so the price was close to it almost immediately. However, it was possible to earn about 15 pips on a long position. The same profit was possible on a short position upon a rebound from the critical line. And the last buy signal could have been ignored, as it was formed too late. But 30 points of profit is not a bad result either.
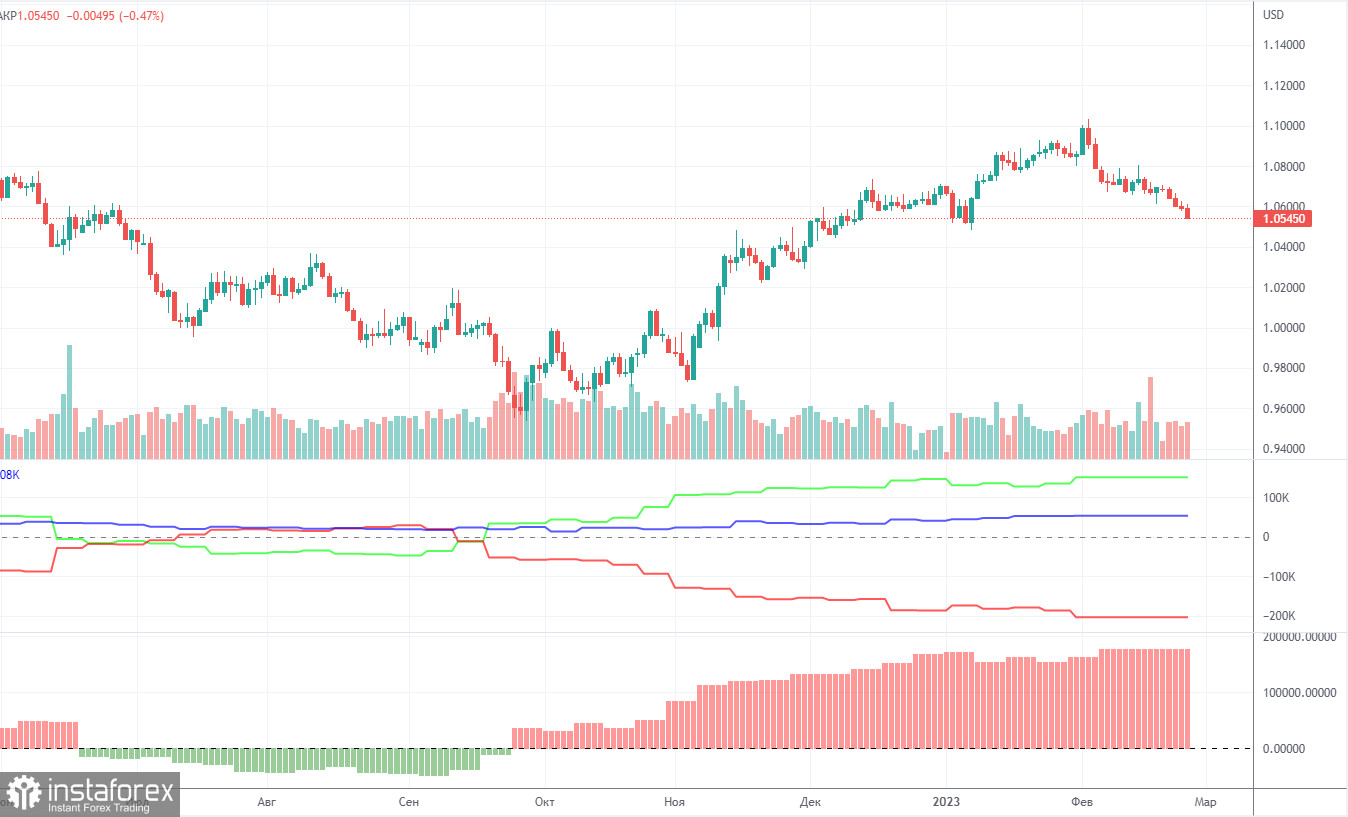
Due to a technical glitch, new COT reports have not been released for almost a month, but on Friday, one of the reports for January 31 was released. This report does not make much sense, because since then, a month has passed, and the data from the next reports (which are more or less up-to-date) are still not available. Therefore, we will analyze the data that are available. The COT reports on EUR/USD have been in line with expectations in recent months. The net non-commercial position has been on the rise since September. Around the same time, the euro started to rise. The bullish non-commercial position rises with each new week. Taking into account this fact, we may assume that the uptrend will soon come to an end. The red and green lines of the first indicator are far apart, which is usually a sign of the end of a trend. The euro has already started to fall, but it is not clear yet, is it a pullback or a new downtrend? In the reporting week, non-commercial traders opened 9,000 long positions while the number of shorts decreased by 7,100. Correspondingly, the net position increased by 16,100. The number of long positions exceeds that of short ones by 148,000. In any case, a correction has been looming for a long time. Therefore, even without reports, it is clear that the downtrend will continue.
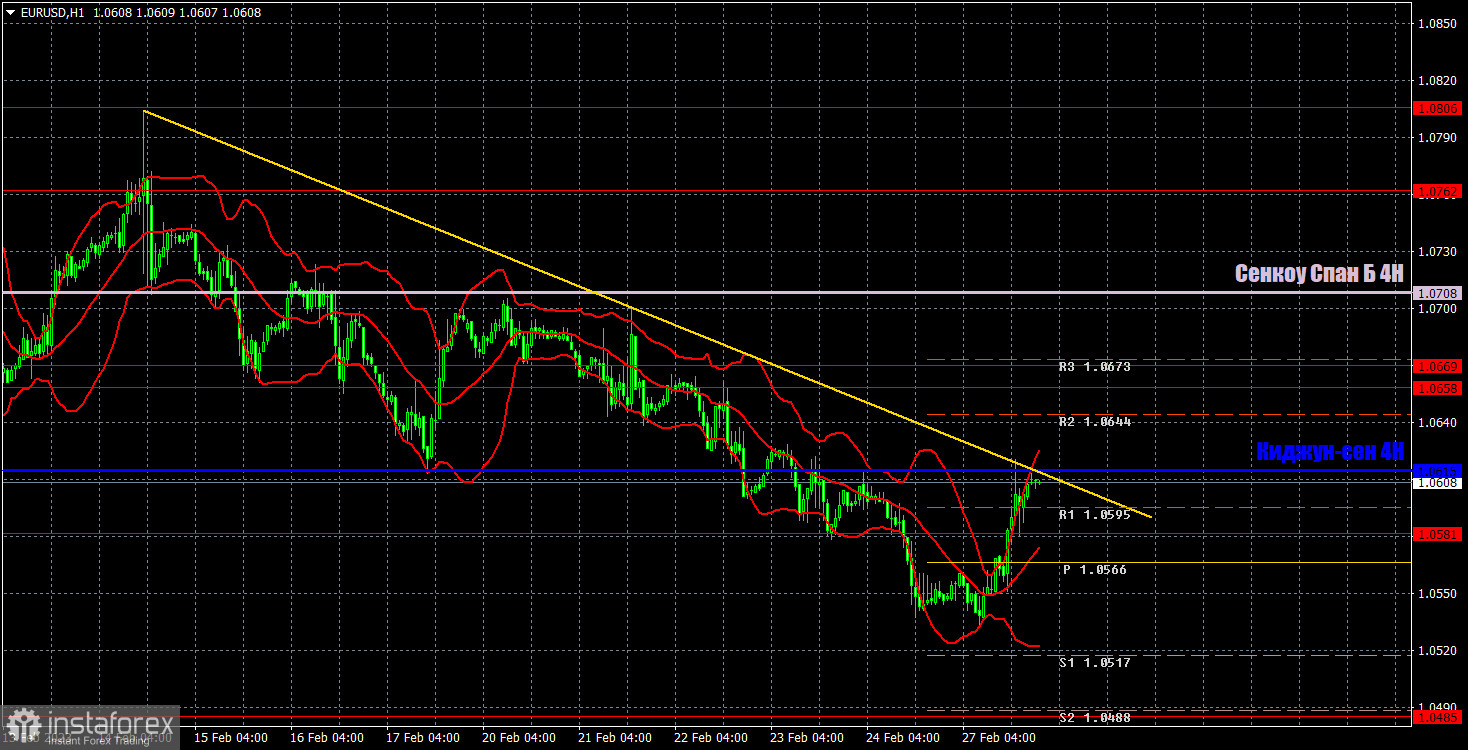
On the one-hour chart, the pair maintains the bearish mood and trades below the Ichimoku indicator lines. We also formed a descending trend line, consolidating above which will determine the end of the downtrend. Despite the correction on Monday, the downtrend could easily resume with a bounce from the Kijun-Sen and the trend line. On Tuesday, important levels are seen at 1.0340-1.0366, 1.0485, 1.0581, 1.0658-1.0669, 1.0762, as well as the Senkou Span B (1.0708) and Kijun-sen (1.0615). Ichimoku indicator lines can move intraday, which should be taken into account when determining trading signals. There are also support and resistance although no signals are made near these levels. They could be made when the price either breaks or rebounds from these extreme levels. Do not forget to place Stop Loss at the breakeven point when the price goes by 15 pips in the right direction. In case of a false breakout, it could save you from possible losses. On February 28, there are no important events planned in the European Union and the United States. In theory, with an empty fundamental background, the bulls will not have enough strength to overcome the critical line and the trend line. Therefore, I expect the euro to fall today. Otherwise, we'll have an uptrend.
Resistance/support - thick red lines, near which the trend may stop. They do not make trading signals.
Kijun-sen and Senkou Span B are the Ichimoku indicator lines moved to the hourly timeframe from the 4-hour timeframe. They are also strong lines.
Extreme levels are thin red lines, from which the price used to bounce earlier. They can produce trading signals.
Yellow lines are trend lines, trend channels, and any other technical patterns.
Indicator 1 on the COT chart is the size of the net position of each trader category.
Indicator 2 on the COT chart is the size of the net position for the Non-commercial group of traders
Relevance up to 01:00 UTC+1 This information is provided to retail and professional clients as part of marketing communication. It does not contain and should not be construed as containing investment advice or investment recommendation or an offer or solicitation to engage in any transaction or strategy in financial instruments. Past performance is not a guarantee or prediction of future performance. Instant Trading EU Ltd. makes no representation and assumes no liability as to the accuracy or completeness of the information provided, or any loss arising from any investment based on analysis, forecast or other information provided by an employee of the Company or otherwise. Full disclaimer is available here.
