
Short-term downside momentum in Gold (XAU/USD) shows signs of easing, with bullish divergence signal

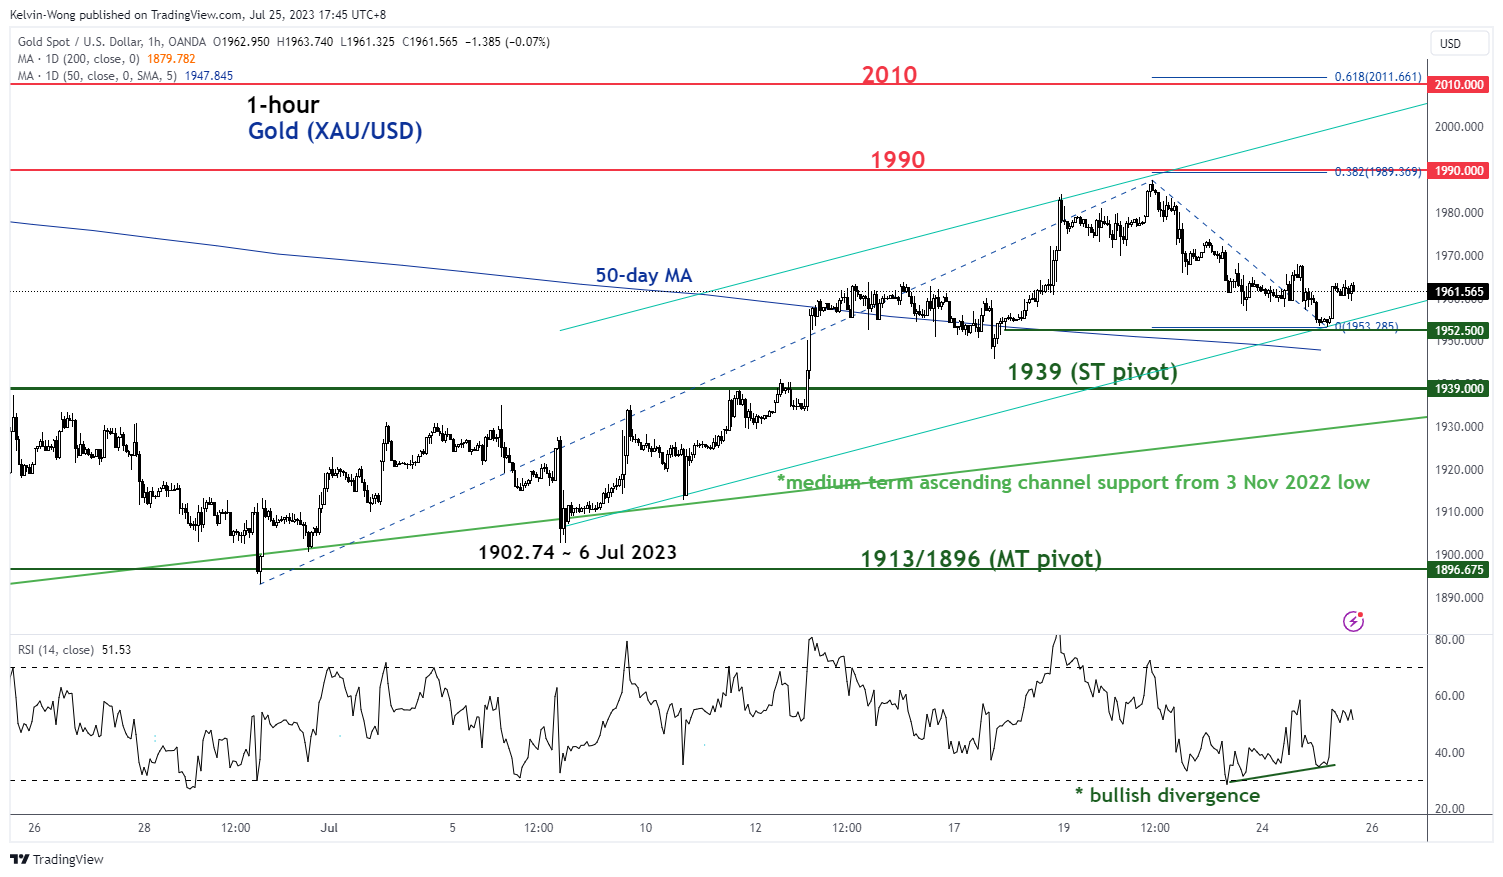
Fig 2: Gold (XAU/USD) minor short-term uptrend of 25 Jul 2023 (Source: TradingView, click to enlarge chart)
As seen on the 1-hour chart of Gold (XAU/USD), its recent slide from its 20 July 2023 high of US$ US$1,987.53 has reached the lower boundary of a minor ascending channel from 6 July 2023 low now acting as near-term support at US$1,952.50.
In addition, the hourly RSI oscillator has flashed a bullish divergence signal at its oversold region. These observations suggest that the downside momentum of the 5-day slide from the 20 July 2023 high has started to wane where a potential short-term bullish reversal may take shape.
Watch the US$1,939 key short-term pivotal support (also close to the 50-day moving average) with the intermediate resistance at US$1,990, and clearance above it sees US$2,010 next (the upper boundary of the minor ascending channel).
However, a break below US$1,939 invalidates the bullish reversal scenario to expose the medium-term support zone of US$1,913/1,896.
