
Keep your eye on the ball. Just because the GDX ETF went up last week doesn’t mean that it’s in an uptrend. Corrections are part of the game.
Just as the USD Index recently (last week) suffered a countertrend decline within a medium-term uptrend, so has the GDX ETF experienced a corrective upswing within a medium-term downtrend.
Nothing moves in a straight line, so recent developments in both the gold miners and the USD Index are nothing to worry about. Everyone is still on track. Gold and the miners are headed for a medium-term downtrend and the USD Index is still gathering steam and will be leaving the station.
With the gold miners attempting to dig themselves out of their 2021 hole, the labor of love could end as quickly as it began. With a temporary retreat of the USD Index last week and dormant U.S. Treasury yields doing much of the heavy lifting, the GDX ETF had plenty of help breaking down its wall of worry.
However, with April showers likely to derail further construction activity, off-site momentum may not be as kind. Case in point: the GDX ETF is still trading below the neckline of its bearish head & shoulders pattern, and while the senior miners’ bounce above their March high may seem like a ground-breaking event, the synthetic strength is likely to hammer the miners over the medium term. Why so? Well, like a current running on extremely low voltage, Friday’s (Apr. 9) intraday bounce occurred on relatively low volume – with the positive momentum evaporating into the close.
Please see below:
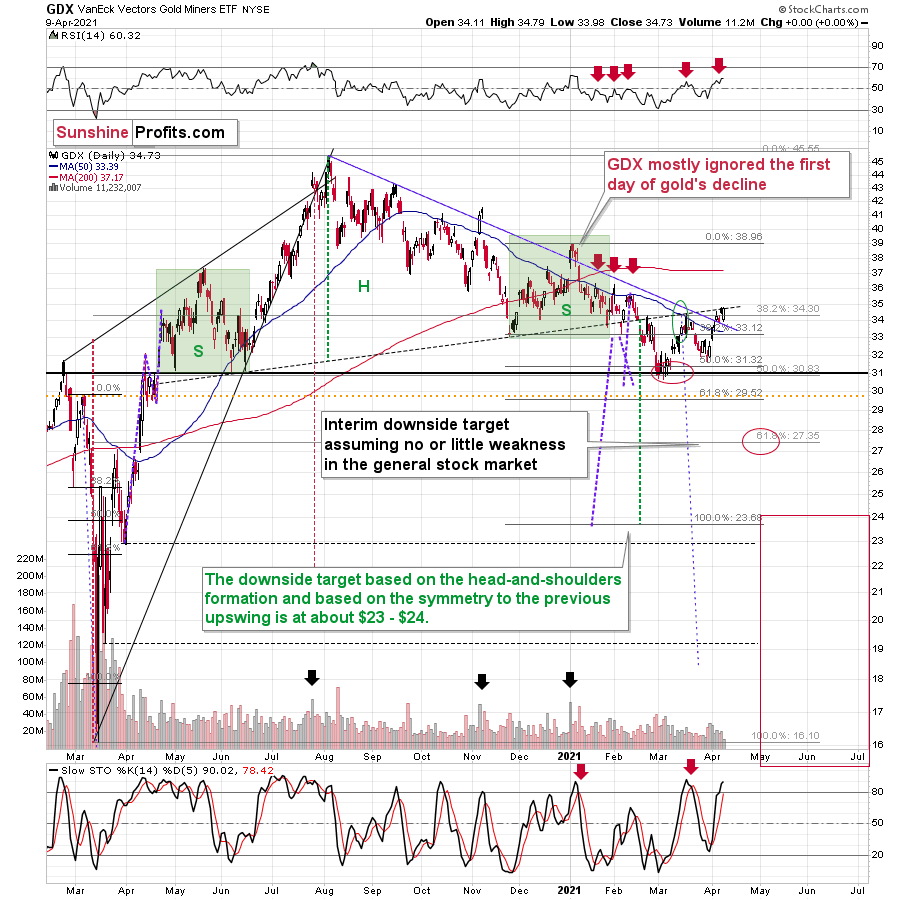
As further evidence, the March/April corrective upswing took the form of a zigzag pattern, which is indicative of a countertrend move within a medium-term downtrend. In addition, if you analyze the chart above, notice how fits and starts were part of the senior miners’ price action back in January? In both cases, the GDX ETF moved above the declining blue resistance line and the 50-day moving average. Yet … the GDX ETF is lower now than it was then.
Furthermore, back in January, the GDX ETF initially ignored gold’s daily (Jan. 6) weakness. Thus, Friday’s (Apr. 9) outperformance by the GDX ETF is far from an all-clear. In fact, it could be the final creak before the foundation crumbles.
Some might say that mining stocks are showing strength compared to gold as the GDX to gold ratio broke above its declining resistance line.
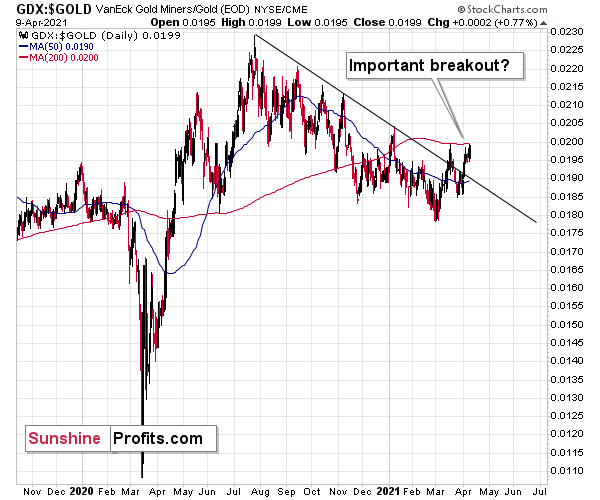
However, I don’t think it’s fair to say so. I think that seeing a breakout in the GDX to gold ratio is not enough for one to say that the miners to gold ratio is breaking higher.
After all, the GDX ETF is just one proxy for mining stocks, and if miners were really showing strength here, one should also see it in the case of other proxies for the mining stocks when compared to gold.
For instance, the HUI Index to gold ratio, the XAU Index to gold ratio, and the GDXJ ( junior mining stocks ) to gold ratio.
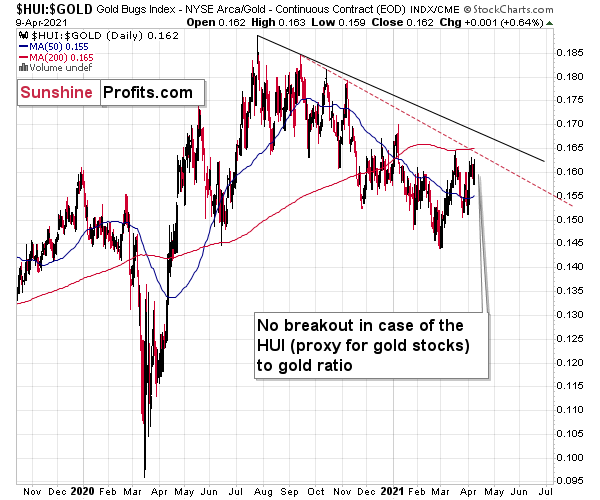
There is no breakout in the HUI to gold ratio whatsoever. In fact, the ratio is quite far from its declining resistance line. Even if we chose other late-2020 tops to draw this line, there would still be no breakout.
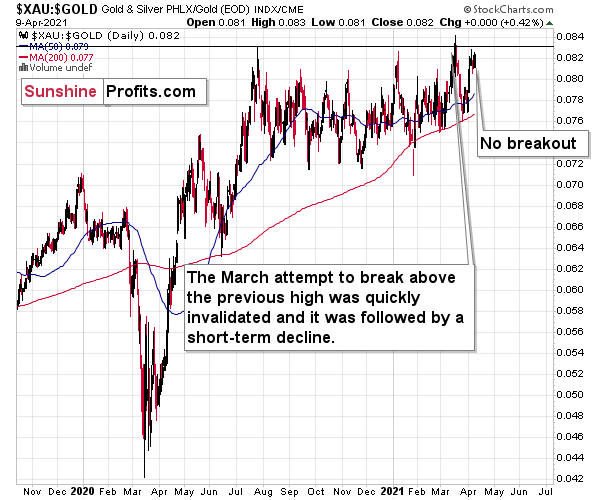
There is no breakout in the XAU to gold ratio either. The previous attempts for the XAU to gold ratio to rally above their 2020 high marked great shorting opportunities, which is very far from being a bullish implication.
But the most bearish implication comes from gold’s ratio with another ETF – the GDXJ.
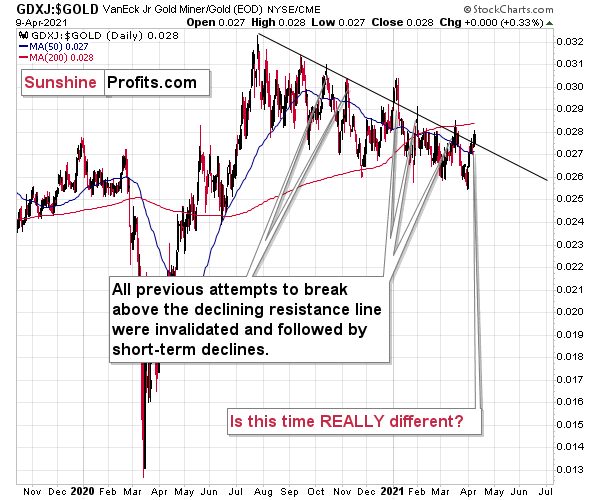
The breakout in the GDXJ to gold ratio is only tiny and unconfirmed. These moves always (since Oct. 2020) provided sell signals – the small breakout below the declining resistance line were always invalidated and they were then followed by visible short-term declines.
Five out of five previous attempts to break above the declining resistance line failed and were followed by short-term declines. Is this time really different?
It seems to me that the five out of five efficiency in the GDXJ to gold ratio is more important than a single breakout in the GDX to gold ratio, especially considering that the latter was preceded by a similar breakout in mid-March. That breakout failed and was followed by declines.
Taking all four proxies into account, it seems that the implications are rather neutral to bearish. Especially when taking into account another major ratio - the one between HUI and S&P 500 is after a major, confirmed breakdown.
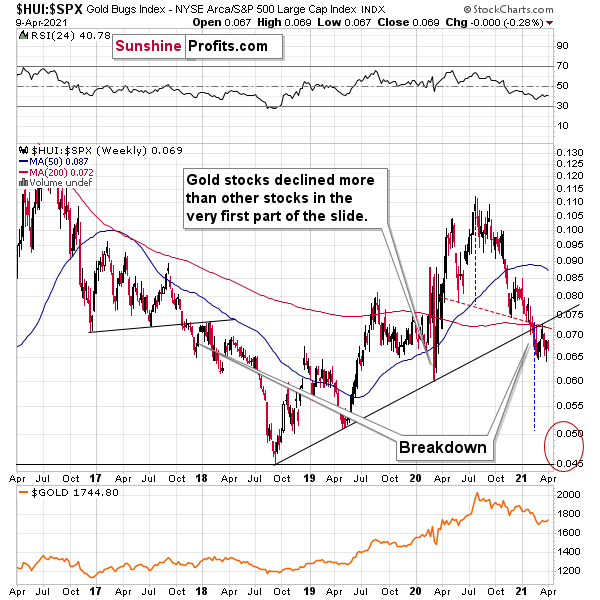
When the ratio presented on the above chart above is rising, it means that the HUI Index is outperforming the S&P 500. When the line above is falling, it means that the S&P 500 is outperforming the HUI Index. If you analyze the right side of the chart, you can see that the ratio has broken below its rising support line. For context, the last time a breakdown of this magnitude occurred, the ratio plunged from late-2017 to late-2018. Thus, the development is profoundly bearish.
Playing out as I expected, a sharp move lower was followed by a corrective upswing back to the now confirmed breakdown level (which is now resistance). Mirroring the behavior that we witnessed in early 2018, after breaking below its rising support line, the HUI Index/S&P 500 ratio rallied back to the initial breakdown level (which then became resistance) before suffering a sharp decline. And with two-thirds of the analogue already complete, the current move lower still has plenty of room to run. Likewise, the early-2018 top in the HUI Index/S&P 500 ratio is precisely when the USD Index began its massive upswing. Thus, with history likely to rhyme, the greenback could spoil the miners’ party once again.
In addition, the HUI to S&P 500 ratio broke below the neck level (red, dashed line) of a broad head-and-shoulders pattern and it verified this breakdown by moving temporarily back to it. The target for the ratio based on this formation is at about 0.05 (slightly above it). Consequently, if the S&P 500 doesn’t decline, the ratio at 0.05 would imply the HUI Index at about 196. However, if the S&P 500 declined to about 3,200 or so (its late-2020 lows) and the ratio moved to about 0.05, it would imply the HUI Index at about 160 – very close to its 2020 lows.
All in all, the implications of mining stocks’ relative performance to gold and the general stock market are currently bearish.
But if we’re headed for a GDX ETF cliff, how far could we fall?
Well, there are three reasons why the GDX ETF might form an interim bottom at roughly ~$27.50 (assuming no big decline in the general stock market ):
- The GDX ETF previously bottomed at the 38.2% and 50.0% Fibonacci retracement levels. And with the 61.8% level next in line, the GDX ETF is likely to garner similar support.
- The GDX ETFs late-March 2020 high should also elicit buying pressure.
- If we copy the magnitude of the late-February/early-March decline and add it to the early-March bottom, it corresponds with the GDX ETF bottoming at roughly $27.50.
Keep in mind though: if the stock market plunges, all bets are off. Why so? Well, because when the S&P 500 plunged in March 2020, the GDX ETF moved from $29.67 to below $17 in less than two weeks. As a result, U.S. equities have the potential to make the miners’ forthcoming swoon all the more painful.
Also supporting the potential move, the GDX ETF’s head and shoulders pattern – marked by the shaded green boxes in the first chart above – signals further weakness ahead.
I wrote previously:
The most recent move higher only made the similarity of this shoulder portion of the bearish head-and-shoulders pattern to the left shoulder) bigger. This means that when the GDX breaks below the neck level of the pattern in a decisive way, the implications are likely to be extremely bearish for the next several weeks or months.
Turning to the junior gold miners , the GDXJ ETF will likely be the worst performer during the upcoming swoon. Why so? Well, due to its strong correlation with the S&P 500, a swift correction of U.S. equities will likely sink the juniors in the process. Besides, junior miners have been underperforming recently even without general stock market’s help.
Furthermore, erratic signals from the MACD indicator epitomizes the GDXJ ETF’s heightened volatility. Remember though that the MACD indicator is far from a light switch. While false buy signals often precede material drawdowns, the reversals don’t occur overnight. As a result, it’s perfectly normal for the GDXJ ETF to trade sideways or slightly higher for a few days before moving lower.
Please see below:
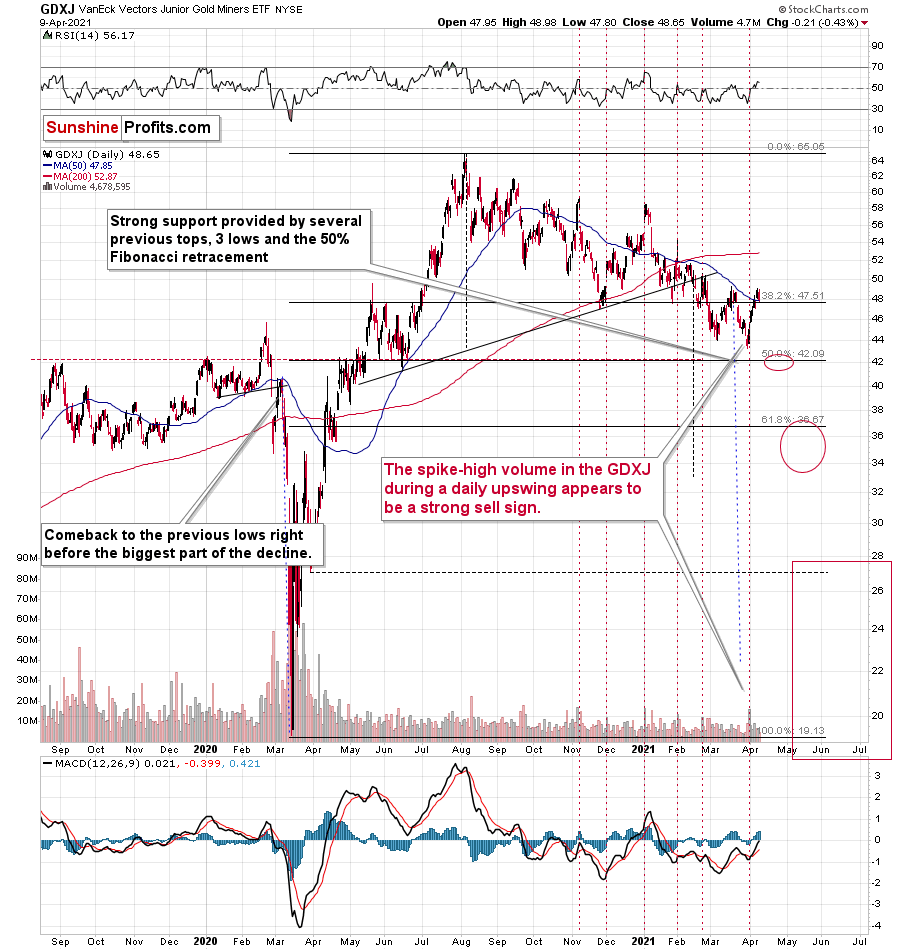
And unlike its senior counterpart, the GDXJ ETF cemented its relative underperformance by moving lower on Friday.
So, how low could the GDXJ ETF go?
Well, absent an equity rout, the juniors could form an interim bottom in the $34 to $36 range. Conversely, if stocks show strength, juniors could form the interim bottom higher, close to the $42.5 level. For context, the above-mentioned ranges coincide with the 50% and 61.8% Fibonacci retracement levels and the GDXJ ETF’s previous highs (including the late-March/early-April high in case of the lower target area). Thus, the S&P 500 will likely need to roll over for the weakness to persist beyond these levels.
Some people (especially the permabulls that have been bullish on gold for all of 2021, suffering significant losses – directly and in missed opportunities) will say that the final bottom is already in. And this might very well be the case, but it seems highly unlikely. On a side note, please keep in mind that I’m neither a permabull nor a permabear for the precious metals sector, nor have I ever been. Let me emphasize that I’m currently bearish (for the time being), but about a month ago, we went long mining stocks on March 4 and exited this profitable trade on March 11.
As another reliable indicator (in addition to the myriads of signals coming not only from mining stocks, but from gold, silver, USD Index, stocks, their ratios, and many fundamental observations) the Gold Miners Bullish Percent Index ($BPGDM) isn’t at levels that elicit a major reversal. The Index is now back at 40. However, far from a medium-term bottom, the latest reading is still more than 30 points above the 2016 and 2020 lows.
Back in 2016 (after the top), and in March 2020, the buying opportunity didn’t present itself until the $BPGDM was below 10.
Thus, with sentiment still relatively elevated, it will take more negativity for the index to find the true bottom.
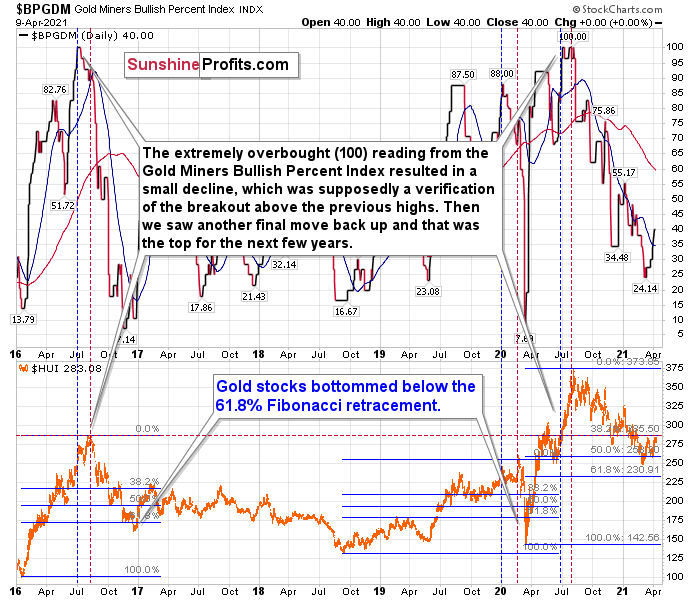
The excessive bullishness was present at the 2016 top as well and it didn’t cause the situation to be any less bearish in reality. All markets periodically get ahead of themselves regardless of how bullish the long-term outlook really is. Then, they correct. If the upswing was significant, the correction is also quite often significant.
Please note that back in 2016, there was an additional quick upswing before the slide and this additional upswing had caused the $BPGDM to move up once again for a few days. It then declined once again. We saw something similar also in the middle of 2020. In this case, the move up took the index once again to the 100 level, while in 2016 this wasn’t the case. But still, the similarity remains present.
Back in 2016, when we saw this phenomenon, it was already after the top, and right before the big decline. Based on the decline from above 350 to below 280, we know that a significant decline is definitely taking place.
But has it already run its course?
Well, in 2016 and early 2020, the HUI Index continued to move lower until it declined below the 61.8% Fibonacci retracement level. The emphasis goes on “below” as this retracement might not trigger the final bottom. Case in point: back in 2020, the HUI Index undershot the 61.8% Fibonacci retracement level and gave back nearly all of its prior rally. And using the 2016 and 2020 analogues as anchors, this time around, the HUI Index is likely to decline below 231. In addition, if the current decline is more similar to the 2020 one, the HUI Index could move to 150 or so, especially if it coincides with a significant drawdown of U.S. equities.
In conclusion, akin to Humpty Dumpty, “all the King's horses and all the King's men” are unlikely to put the GDX ETF back together again. With the HUI Index to gold ratio, the XAU Index to gold ratio and the GDXJ ETF to gold ratio all splintering beneath the surface, the GDX ETF’s recent strength simply masks all of the cracks in the precious metals’ foundation. Furthermore, with the USD Index and U.S. Treasury yields threatening to swing the wrecking ball, the metals’ house of cards could soon face demolition. Thus, even though the long-term outlook for gold, silver , and mining stocks is very bullish, the short- and perhaps medium-term outlooks remain profoundly bearish, and investors that ignore the warning signs will likely find themselves submerged in the rubble.
Thank you for reading our free analysis today. Please note that the above is just a small fraction of today’s all-encompassing Gold & Silver Trading Alert. The latter includes multiple premium details such as the targets for gold and mining stocks that could be reached in the next few weeks. If you’d like to read those premium details, we have good news for you. As soon as you sign up for our free gold newsletter, you’ll get a free 7-day no-obligation trial access to our premium Gold & Silver Trading Alerts. It’s really free – sign up today.
Przemyslaw Radomski, CFA
Founder, Editor-in-chief
Sunshine Profits: Effective Investment through Diligence & Care
* * * * *
All essays, research and information found above represent analyses and opinions of Przemyslaw Radomski, CFA and Sunshine Profits' associates only. As such, it may prove wrong and be subject to change without notice. Opinions and analyses are based on data available to authors of respective essays at the time of writing. Although the information provided above is based on careful research and sources that are deemed to be accurate, Przemyslaw Radomski, CFA and his associates do not guarantee the accuracy or thoroughness of the data or information reported. The opinions published above are neither an offer nor a recommendation to purchase or sell any securities. Mr. Radomski is not a Registered Securities Advisor. By reading Przemyslaw Radomski's, CFA reports you fully agree that he will not be held responsible or liable for any decisions you make regarding any information provided in these reports. Investing, trading and speculation in any financial markets may involve high risk of loss. Przemyslaw Radomski, CFA, Sunshine Profits' employees and affiliates as well as members of their families may have a short or long position in any securities, including those mentioned in any of the reports or essays, and may make additional purchases and/or sales of those securities without notice.
