
Relevance up to 07:00 2022-07-15 UTC+2 Company does not offer investment advice and the analysis performed does not guarantee results. The market analysis posted here is meant to increase your awareness, but not to give instructions to make a trade.
Trend analysis (Fig. 1).
The price may move downward from the level of 1.1885 (close of yesterday's daily candle) to the target of 1.1806, the lower fractal (red dotted line). When testing this level, the price may continue to move downward with the target at 1.1778, the support level of the downward channel (bold red line). Upon reaching this level, the price may move up.
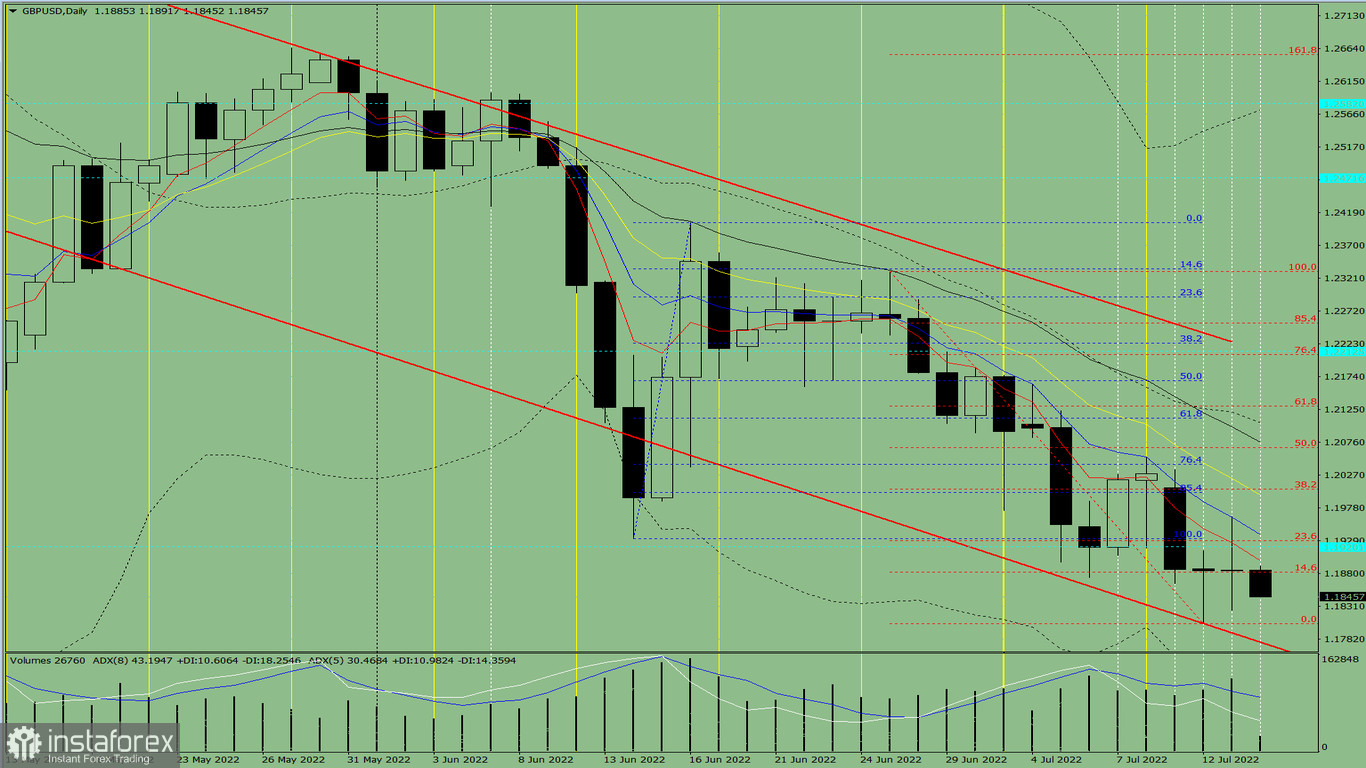
Fig. 1 (daily chart).
Comprehensive analysis:
- Indicator analysis – down;
- Fibonacci levels – down;
- Volumes – down;
- Candlestick analysis – down;
- Trend analysis – down;
- Bollinger bands – down;
- Weekly chart – down.
General conclusion:
Today the price may move downward from the level of 1.1885 (close of yesterday's daily candle) to the target of 1.1806, the lower fractal (red dotted line). When testing this level, the price may continue to move downward with the target at 1.1778, the support level of the downward channel (bold red line). Upon reaching this level, the price may move up.
Alternative scenario: from the level of 1.1885 (close of yesterday's daily candle), the price may move down with the target of 1.1806, the lower fractal (red dotted line). When testing this level, an upward pullback is possible with the target of 1.18820, the 14.6% retracement level (red dotted line). Upon reaching this level, the price may move up.
Read more: https://www.instaforex.eu/forex_analysis/316135
