EUR and Silver: Going Down a One-Way Street

Since the precious metals like to ride along with the EUR/USD, and the latest Eurozone data looks grim, what are the implications for the PMs?
Just when everyone and their brother thought that silver was going straight to the moon… it plunged. And that’s not the end of the decline.
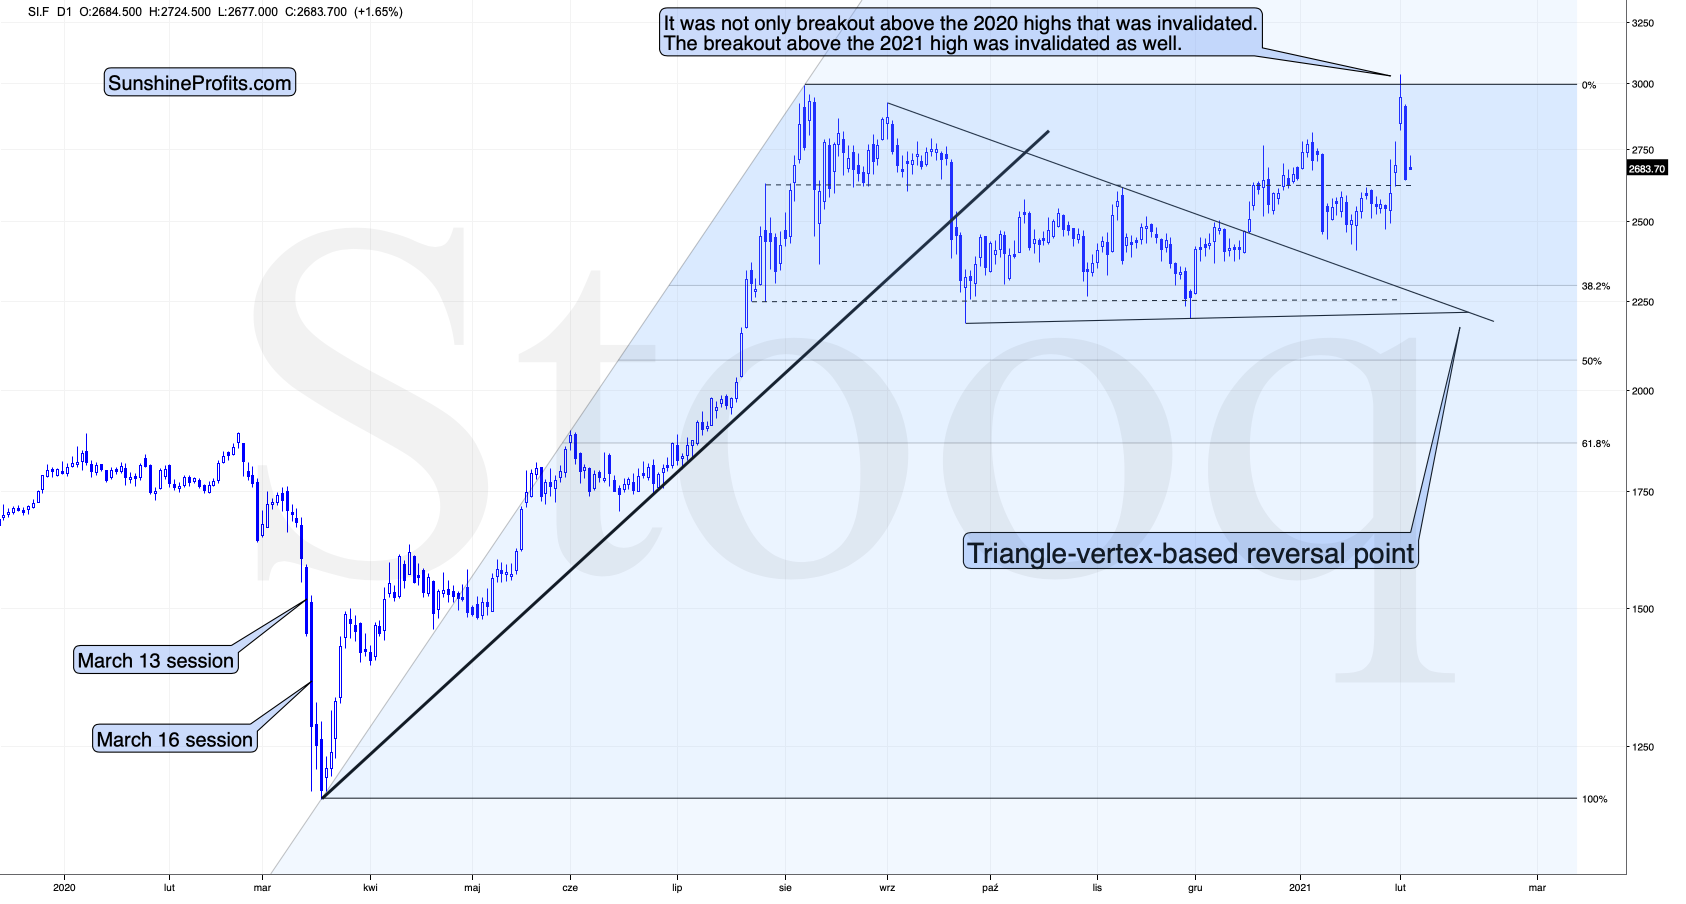
Figure 1 – COMEX Silver Futures
I previously emphasized that silver’s volatile upswing is likely just temporary, and I discussed the Kondratiev cycle which implies much higher gold prices but not necessarily right away, because the value of cash (USD) would be likely to soar as well. The latter would likely trigger a temporary slide in gold – and silver.
Well, was silver’s rally just temporary?
This seems to have been the case. The white metal declined back below not only the 2020 highs, but also back below this year’s early high. Please remember that invalidations of breakouts have immediately bearish implications and we just saw more than one in case of silver.
So far today (Feb. 3), silver is quiet, but let’s keep in mind that back in September, it took only a few sessions for the white precious metal to move from approximately the current price levels to about $22.
Will silver slide as much shortly? This is quite likely, although the downswing doesn’t have to be as quick as it was in September.
Terms like the silver shortage , the size of the silver market and silver manipulation became incredibly popular in the last couple of days, which - together with huge SLV volume, and this ETF’s inflows - confirms the dramatic increase in interest in this particular market. This is exactly what happens close to market tops: silver steals the spotlight while mining stocks are weak. I’ve seen this countless times , and in most cases, it was accompanied by multiple voices of people “feeling” that the silver market is about to explode. For example, please consider what happened in early September 2020 on both (above and below) charts. Silver jumped and almost reached its August 2020 high, while the GDX was unable to rally even to (let alone above) its mid-August high.
Don’t get me wrong, I think that silver will soar in the following years and I’m not shorting silver (nor am I suggesting this) right now and in fact I haven’t been on the short side of the silver market for months. In fact, I expect silver to outperform gold in the final part of the next massive upswing, but… I don’t think this massive upswing has started yet.
Gold had it’s nice post-Covid panic run-up, but it didn’t manage to hold its breakout above the 2011 highs, despite multiple dovish pledges from the Fed, the open-ended QE, and ridiculously low interest rates. Plus, while gold moved above its 2011 highs, gold stocks have barely corrected half of their decline from their 2011 highs. Compare that to when the true bull market started about two decades ago – gold miners were soaring and multiplying gold’s gains in the medium run.
Let’s take a look at mining stocks, using the GDX ETF as a proxy for them.
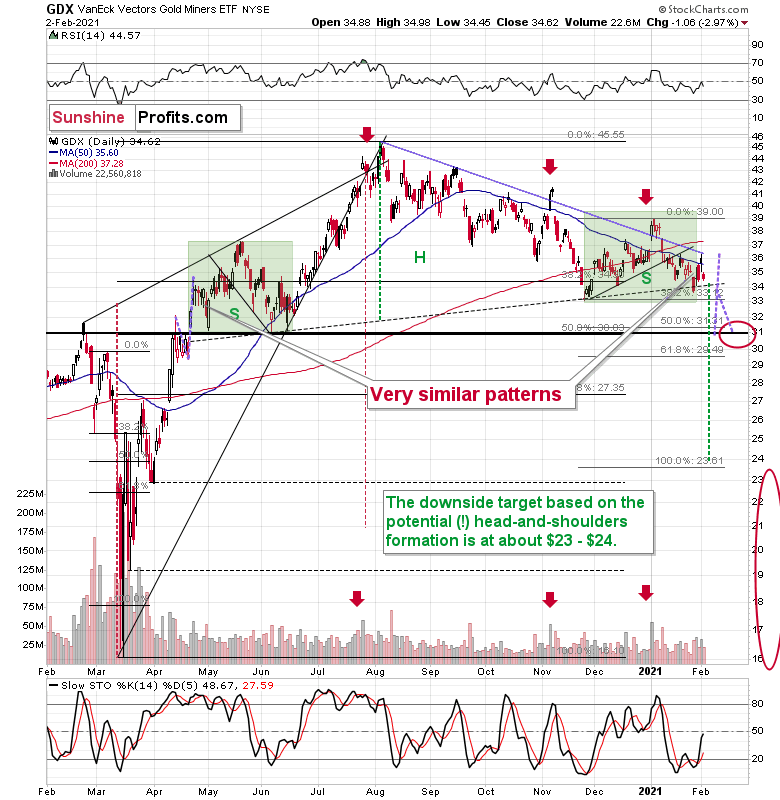
Figure 2 – VanEck Vectors Gold Miners ETF (GDX)
Are miners weak right now? Of course, they are weak. It was not only silver that got attention recently, but also silver stocks . The GDX ETF is mostly based on gold stocks, but still, silver miners’ performance still affects it. And… GDX is still trading relatively close to the yearly lows. Silver moved a bit above its 2020 highs – did miners do that as well? Absolutely not, they were only able to trigger a tiny move higher.
And based on yesterday’s decline, most of the recent run-up was already erased.
Interestingly, the most recent move higher only made the similarity of this shoulder portion of the bearish head-and-shoulders pattern to the left shoulder ( figure 2 - both marked with green) bigger. This means that when the GDX breaks below the neck level of the pattern in a decisive way, the implications are likely to be extremely bearish for the next several weeks or months.
Due to the uncanny similarity between the two green rectangles, I decided to check what happens if this mirror-similarity continues. I used purple, dashed lines for that. There were two important short-term price swings in April 2020 – one shows the size of the correction and one is a near-vertical move higher.
Copying these price moves (purple lines) to the current situation, we get a scenario in which GDX (mining stocks) moves to about $31 and then comes back up to about $34. This would be in perfect tune with what I wrote previously. After breaking below the head-and-shoulders pattern, gold miners would then be likely to verify this breakdown by moving back up to the neck level of the pattern. Then, we would likely see another powerful slide – perhaps to at least $24.
All in all, it seems that silver’s run-up was just a temporary phenomenon and the next big medium-term move in the precious metals and mining stocks is going to be to the downside.
Having said that, let’s take a look at the markets from the fundamental point of view.
For weeks , I’ve been warning that the fundamental disconnect between the U.S. and Eurozone economies could pressure the EUR/USD.
And on Jan. 29, I wrote:
The economic divergence between Europe and the U.S. continues to widen. On Jan. 28, the U.S. Bureau of Labor Statistics (BLS) revealed that U.S. GDP (advanced estimate) likely expanded by 4.0% in the fourth-quarter.
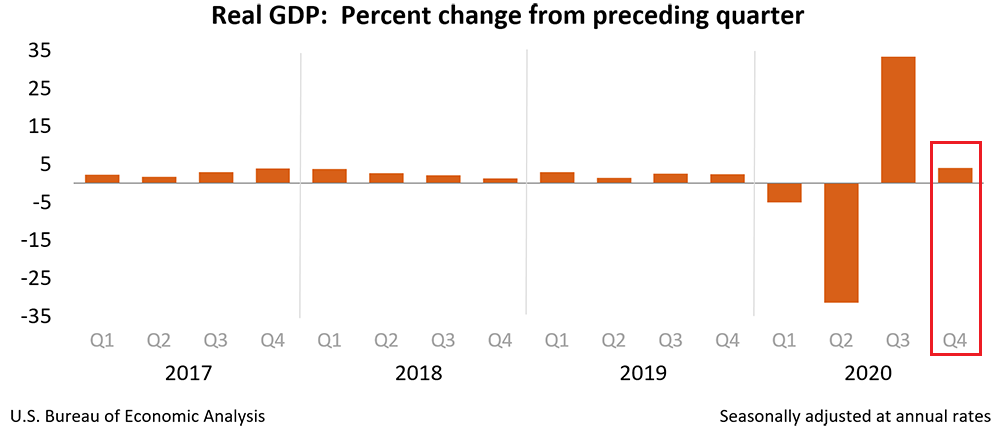
Figure 3
Making its counter move, Eurozone fourth-quarter GDP was released on Feb. 2, revealing that the European economy shrank by 0.7% (the red box below). Even more revealing, France and Italy – Europe’s second and third-largest economies – underperformed the bloc average, contracting by 1.3% and 2.0% respectively (the blue box below).
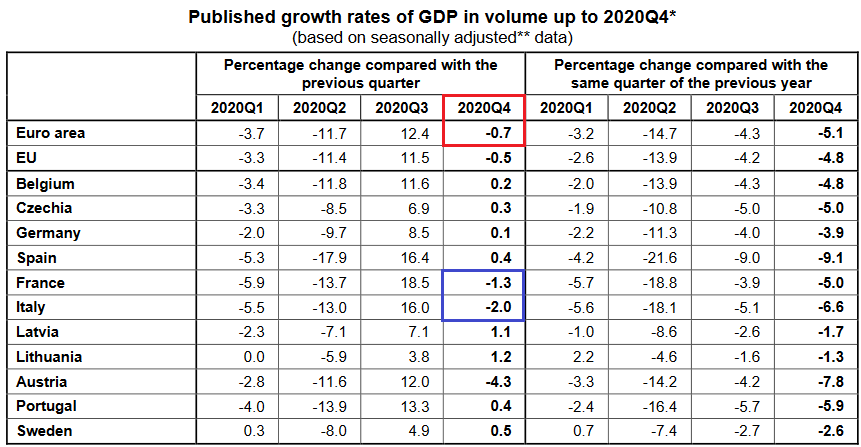
Figure 4 - Source: Eurostat
In addition, German retail sales (released on Feb. 1) declined by 9.6% in December – well below the 2.6% contraction expected by economists. And why is this relevant? Because the month-over-month decline was the largest since 1956 and speaks volumes coming from Europe’s largest economy.
Please see below:
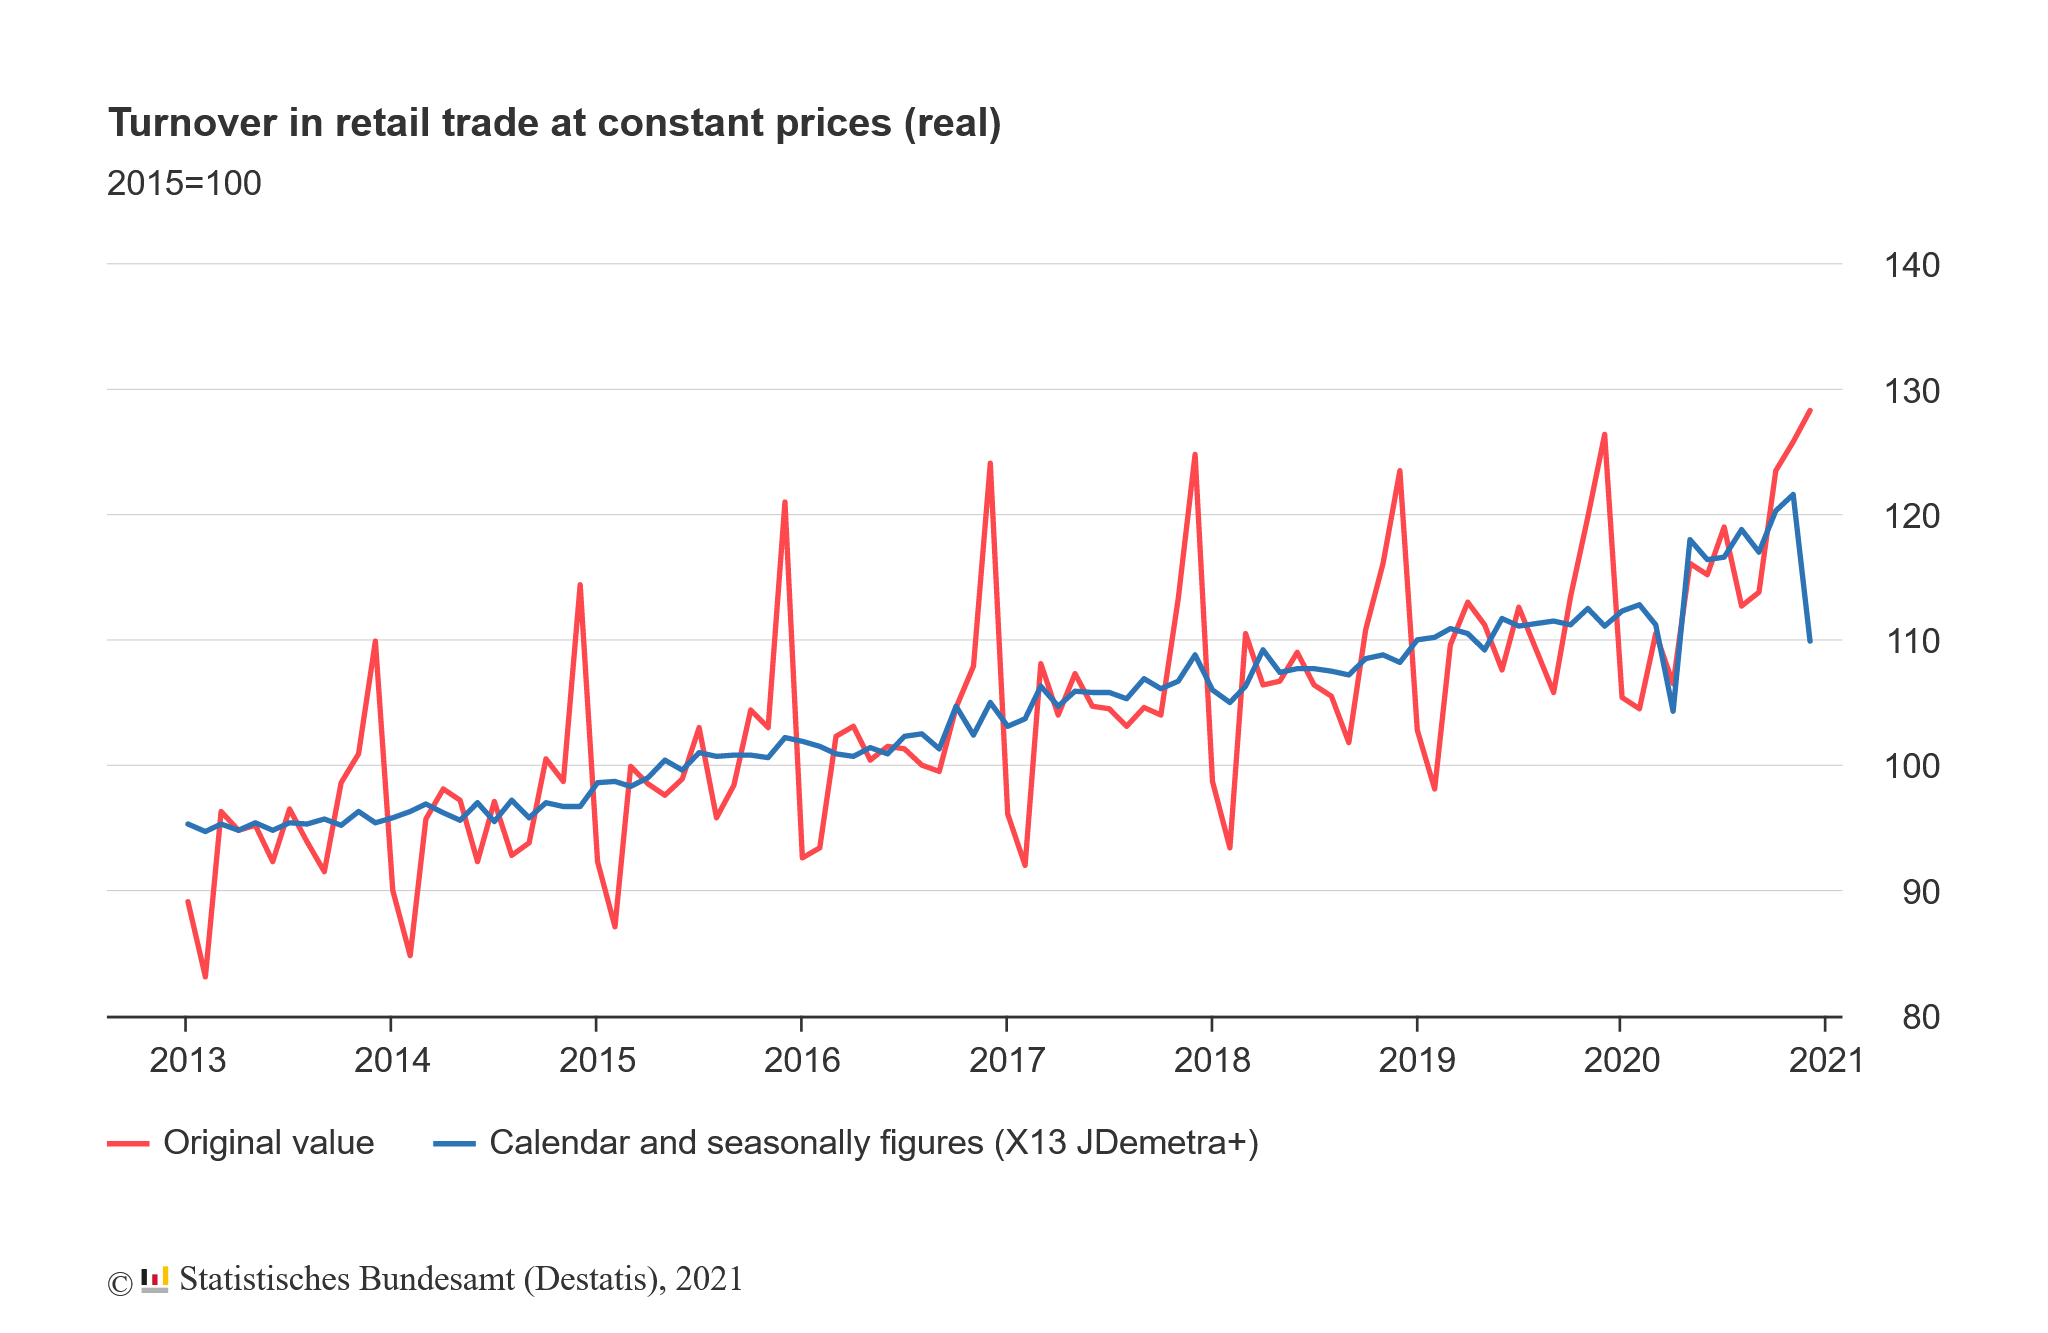
Figure 5
If that wasn’t enough, Spain’s (Europe’s fourth-largest economy) Q4 GDP inched up by only 0.40% (the red box below). And not only did the figure come in well below the Spanish government’s December estimate (of an increase of 2.40%), the country’s exports declined by 1.4%, while business investment plunged by 6.2% (the blue boxes below).
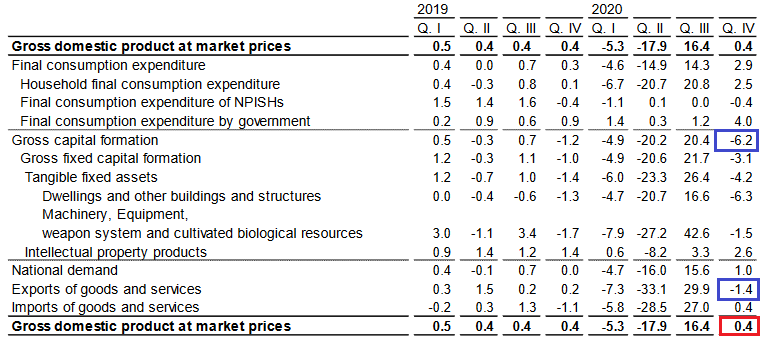
Figure 6 - Source: Instituto Nacional de Estadística (Spain’s National Statistics Institute)
Moreover, as the fiscal situation worsens across Europe’s four-largest economies, the European Central Bank (ECB) has no choice but to pick up the slack. As of Feb. 2, the ECB’s balance sheet now totals more than 70% of Eurozone GDP (up from 69%). More importantly though, the figure is more than double the U.S. Federal Reserve’s (FED) 34.5% (down from 35%).
Please see below:
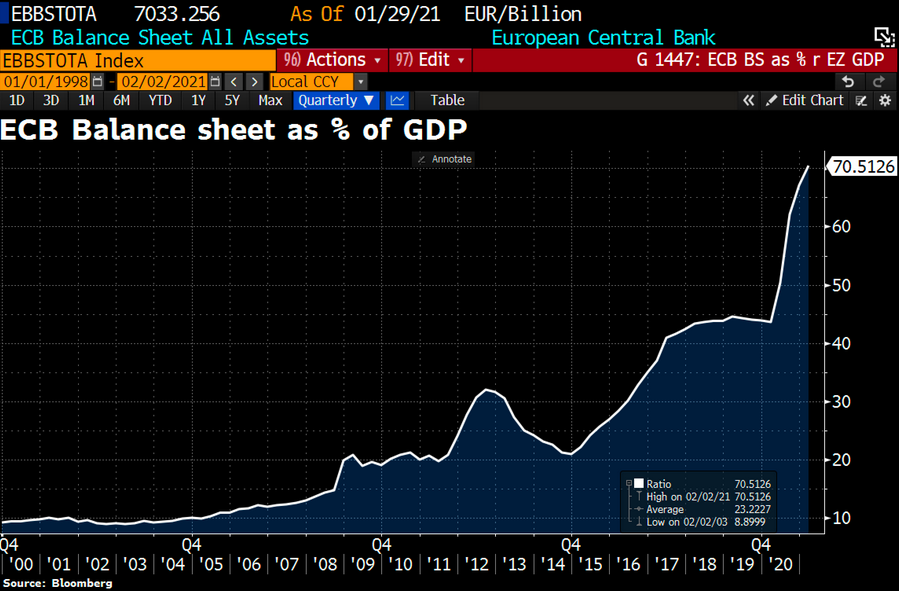
Figure 7
Thus, while the ECB’s money printer works overtime relative to the FED’s, the dominoes are lining up for a material fall:
To explain, please see below:
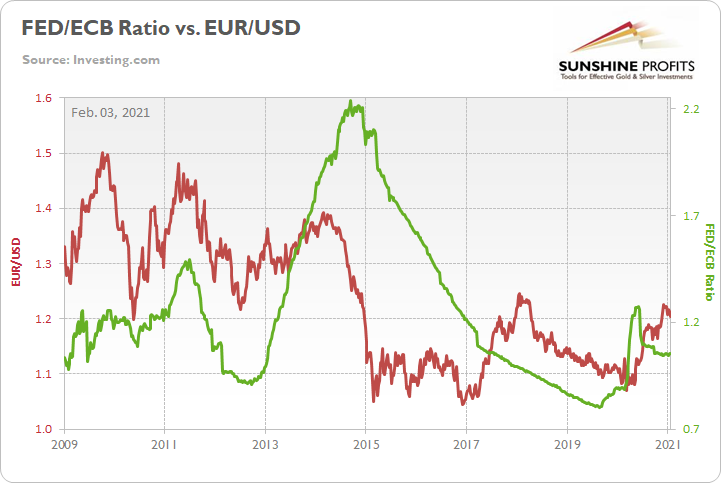
Figure 8
The red line above depicts the movement of the EUR/USD, while the green line above depicts the FED/ECB ratio. As you can see, when the green line rises (the FED is outprinting the ECB), the EUR/USD also tends to rise. Conversely, when the green line falls (the ECB is outprinting the FED), the EUR/USD tends to fall.
As it stands today, the FED/ECB ratio has declined by 0.26% week-over-week and is down by nearly 18% since June. And if you analyze the right side of the chart, you can see that the EUR/USD is starting to notice. As the FED/ECB ratio tracks lower, the EUR/USD is starting to roll over. And if history is any indication, the EUR/USD has plenty of catching up to do.
Also signaling a profound EUR/USD decline, I warned on Jan. 27 that the EUR/GBP could be the canary in the coal mine.
On Monday (Jan. 25), I wrote that Janet Yellen’s pledge to “act big” on the next coronavirus relief package ushered the EUR/GBP back above critical support.
However, on Tuesday (Jan. 26), the key level broke again.
Please see below:
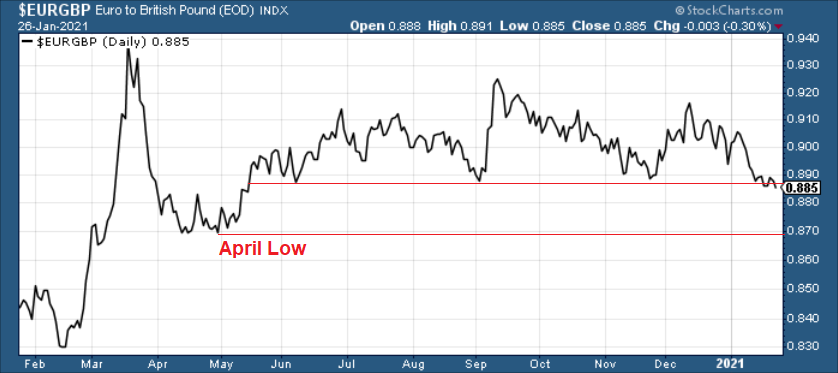
Figure 9
More importantly though, a break in the EUR/GBP could be an early warning sign of a forthcoming break in the EUR/USD.
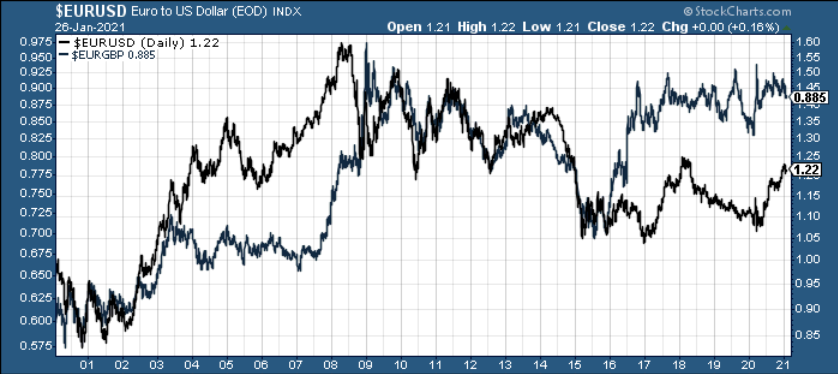
Figure 10
If you analyze the chart above, ~20 years of history shows that the EUR/GBP and the EUR/USD tend to follow in each other’s footsteps. As a result, if the EUR/GBP retests its April low (the next support level), the EUR/USD is likely to tag along for the ride (which implies a move back to ~1.08).
As it stands today, the wheels are already in motion. On Feb. 2, the EUR/GBP made another fresh low and the initial support level is all but gone.
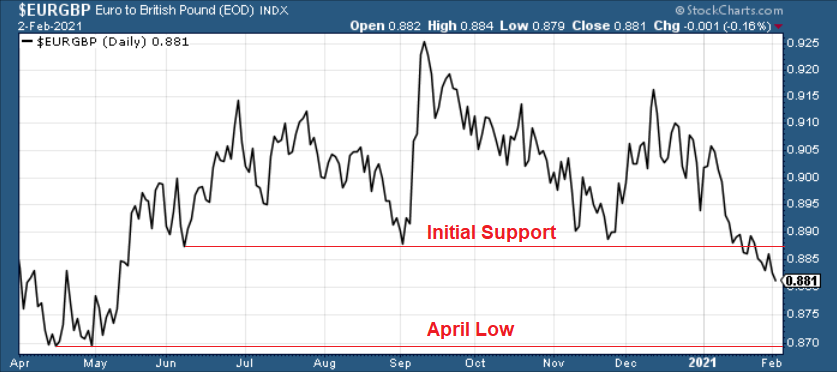
Figure 11
Furthermore, notice how the EUR/USD is tracking the EUR/GBP lower? Despite being a fair distance from the ~1.08 level, the euro’s weakness relative to sterling is a sign that the Eurozone calamity is finally starting to weigh on its currency.
If you analyze the chart below, you can see that the EUR/USD has already broken below its December and January support.
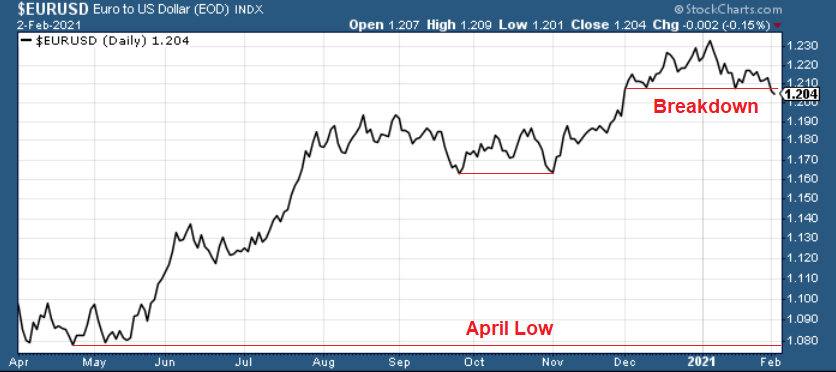
Figure 12
More importantly though, we could be approaching a point of no return.
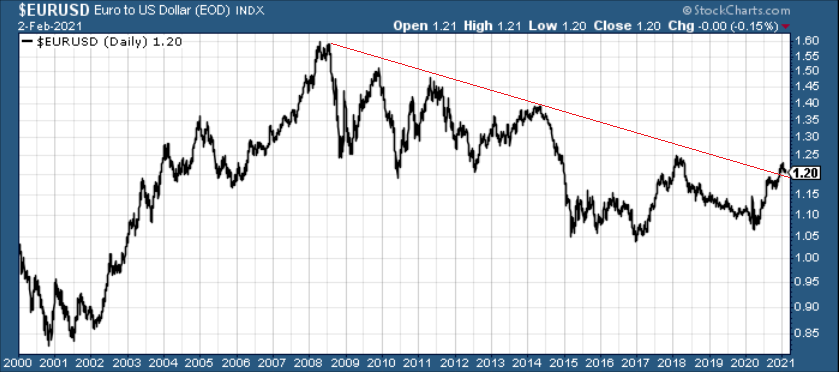
Figure 13
Barely breaking out of a roughly 12-year downtrend, the EUR/USD has yet to invalidate the declining long-term resistance line. As a result, and with the EUR/USD already rolling over, a break below the 1.16/1.17 level puts ~1.08 well within the range of the 2015/2016 lows.
And how could this affect the PMs?
Well, notice how they like to tag along for the EUR/USD’s ride?
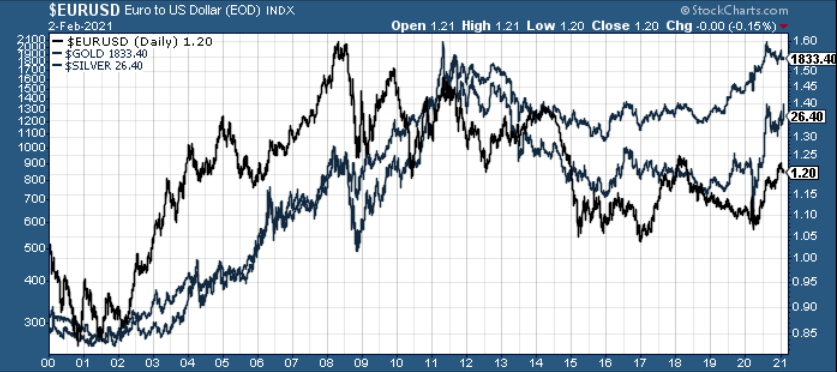
Figure 14
Despite silver’s short squeeze providing a short-term reprieve, it’s no surprise that the EUR/USD’s weakness has been met with angst by the PMs.
Please see below:
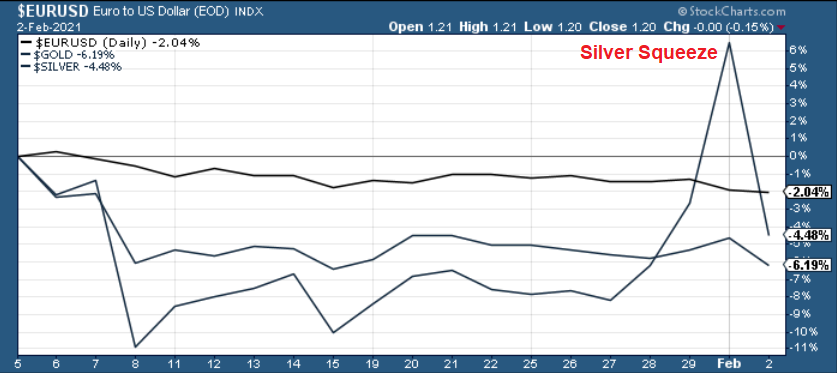
Figure 15
As a result, the floundering euro is ushering the PMs down a one-way street. And while they may veer off to view the scenery from time to time, they all remain on a path to lower prices. Thus, yesterday’s sell-off highlights the superficiality of Monday’s (Feb. 1) surge. But while finding a true bottom requires time and patience, once it occurs, the PMs long-term uptrend will resume once again.
Thank you for reading our free analysis today. Please note that the above is just a small fraction of today’s all-encompassing Gold & Silver Trading Alert. The latter includes multiple premium details such as the targets for gold and mining stocks that could be reached in the next few weeks. If you’d like to read those premium details, we have good news for you. As soon as you sign up for our free gold newsletter, you’ll get a free 7-day no-obligation trial access to our premium Gold & Silver Trading Alerts. It’s really free – sign up today.
Przemyslaw Radomski, CFA
Founder, Editor-in-chief
Sunshine Profits: Effective Investment through Diligence & Care
* * * * *
All essays, research and information found above represent analyses and opinions of Przemyslaw Radomski, CFA and Sunshine Profits’ associates only. As such, it may prove wrong and be subject to change without notice. Opinions and analyses are based on data available to authors of respective essays at the time of writing. Although the information provided above is based on careful research and sources that are deemed to be accurate, Przemyslaw Radomski, CFA and his associates do not guarantee the accuracy or thoroughness of the data or information reported. The opinions published above are neither an offer nor a recommendation to purchase or sell any securities. Mr. Radomski is not a Registered Securities Advisor. By reading Przemyslaw Radomski’s, CFA reports you fully agree that he will not be held responsible or liable for any decisions you make regarding any information provided in these reports. Investing, trading and speculation in any financial markets may involve high risk of loss. Przemyslaw Radomski, CFA, Sunshine Profits’ employees and affiliates as well as members of their families may have a short or long position in any securities, including those mentioned in any of the reports or essays, and may make additional purchases and/or sales of those securities without notice.
