A Bearish Correction Of The EUR/USD Pair Keeps Forming

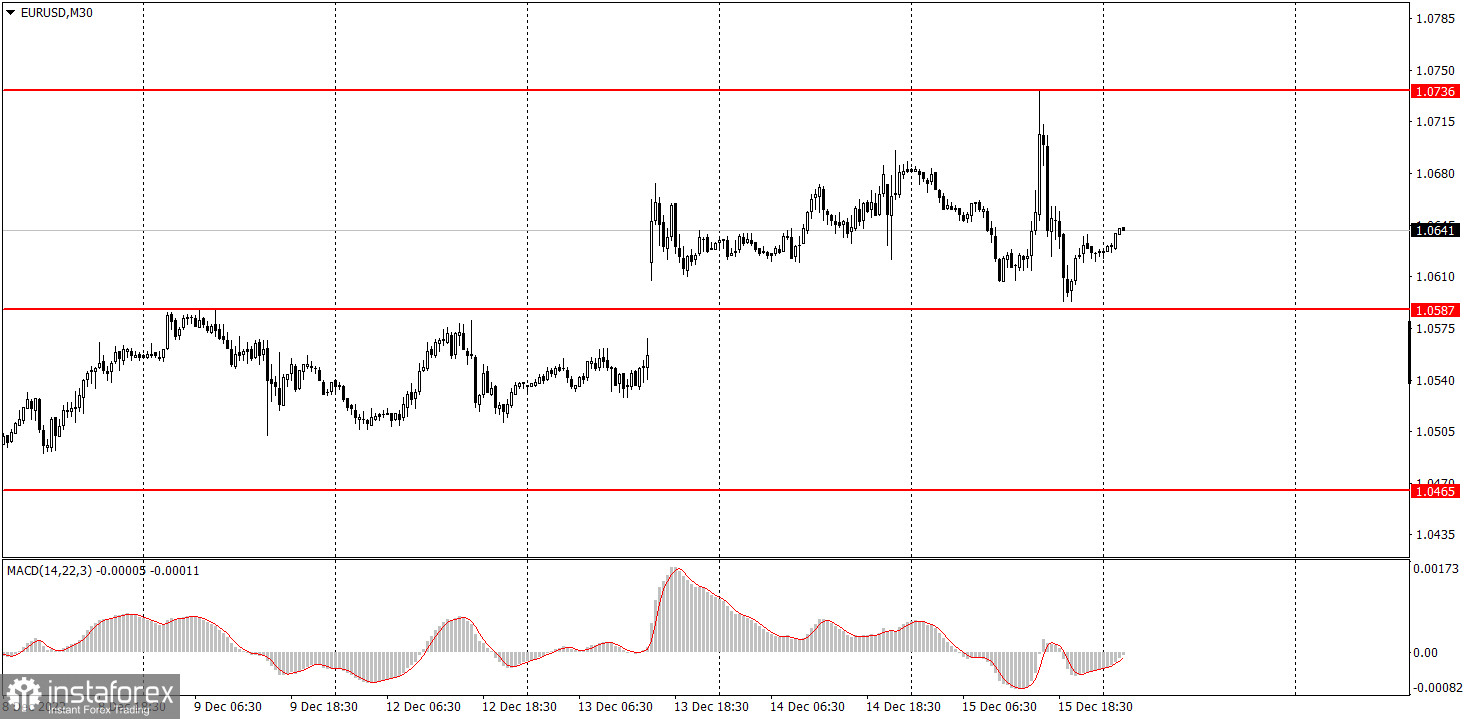
EUR/USD flew from side to side on Wednesday and Thursday. This is exactly what I predicted at the beginning of the week and during the weekend. It was obvious that the results of the meetings of the European Central Bank and the Federal Reserve would not be discouraging or shocking, so there won't be a trend. Nonetheless, volatility should have increased, which we saw. Now that the inflation reports have been released and the meetings are behind us, we can say that the U.S. dollar never found any reason to rise. Yes, we did see a nice growth from the dollar last night, but it still didn't go far from its local highs. The euro has grown by 1200 points for two months, and the current pullback doesn't go over 150 points, so from a technical point of view, there is no reason to talk about the beginning of a downtrend. There are no signs of a possible downward movement on the higher charts. The results of ECB and Fed meetings were quite flat - both of them raised the rates by 0.5%, and both of them indicated that the rates will keep rising. There was no good reason to favor any currency over the other.
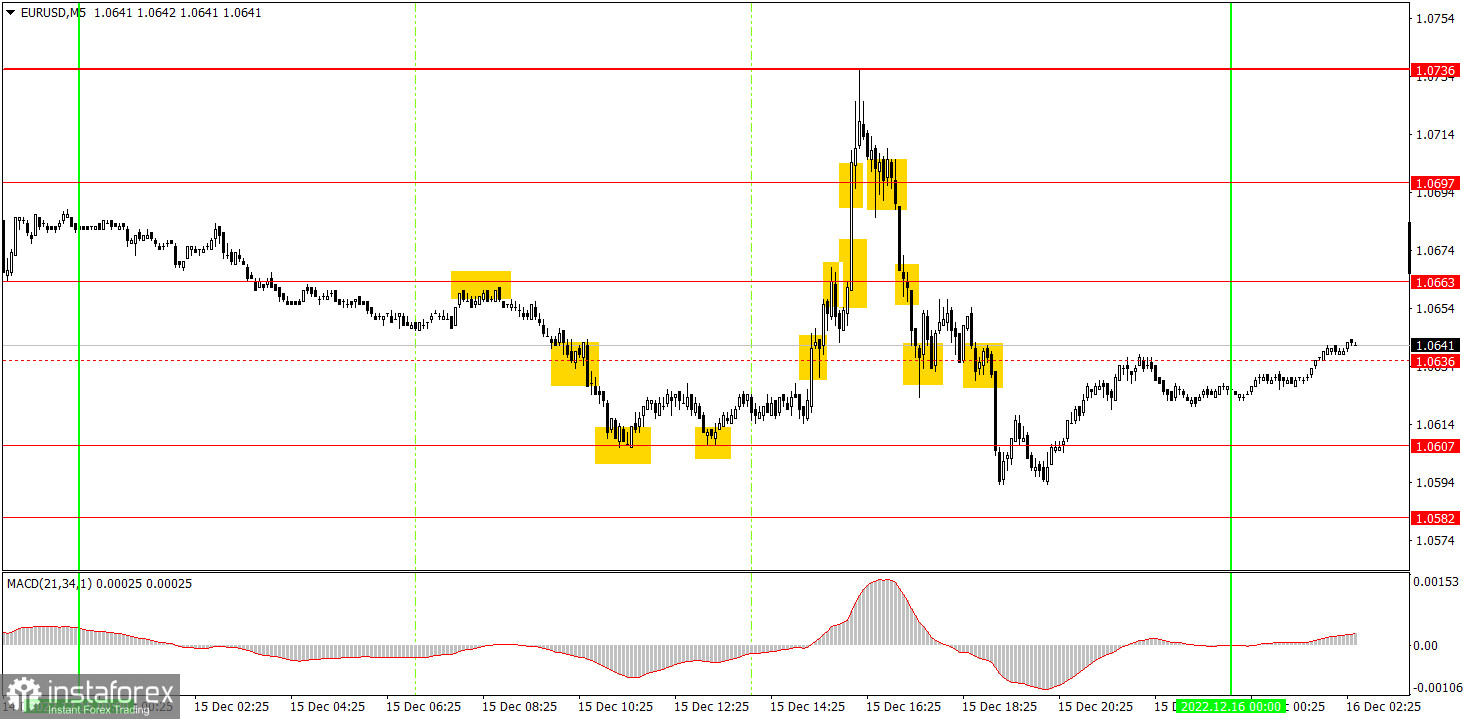
Trading signals found in the European trading session were quite good. In the very beginning, there was a sell signal near 1.0663, afterwards the pair fell to 1.0607, which made it possible for beginners to earn about 35 pips. There was a double buy signal near 1.0607, but it was also worth working out. Approaching the time when the ECB was about to announce the results of its meeting, the pair moved away from 1.0607 so traders were able to set the Stop Loss to Breakeven and stay in the market. Therefore, newcomers could continue to support long positions without much risk. As it turned out, this was the right decision, as the pair continued to rise and even surpassed 1.0697. You could only close the longs when EUR fell below this level. It was possible to get 60-70 points of profit here as well. But all the subsequent signals should not be filled. The sell signal at 1.0697 was formed at a "dangerous time" (although it was profitable), while the rest of the signals were formed too late in time.
The pair moves high on the 30-minute chart even after the two central bank meetings. Thus, there was no drastic change in the technical picture this week. There is still no trend line or channel. A bearish correction keeps forming, but it refuses to start. On the 5-minutes chart on Friday, it is recommended to trade on the levels 1.0465-1.0483, 1.0536, 1.0582-1.0607, 1.0663, 1.0697, 1.0736, 1.0787, 1.0806. As soon as the price passes 15 pips in the right direction, you should set a Stop Loss to breakeven. On Friday, the EU and the US will release business activity indexes for services and manufacturing for December. Although they are less important than the other events this week, investors might react.
1) The strength of the signal is determined by the time it took the signal to form (a rebound or a breakout of the level). The quicker it is formed, the stronger the signal is.
2) If two or more positions were opened near a certain level based on a false signal (which did not trigger a Take Profit or test the nearest target level), then all subsequent signals at this level should be ignored.
3) When trading flat, a pair can form multiple false signals or not form them at all. In any case, it is better to stop trading at the first sign of a flat movement.
4) Trades should be opened in the period between the start of the European session and the middle of the US trading hours when all positions must be closed manually.
5) You can trade using signals from the MACD indicator on the 30-minute time frame only amid strong volatility and a clear trend that should be confirmed by a trendline or a trend channel.
6) If two levels are located too close to each other (from 5 to 15 pips), they should be considered support and resistance levels.
Support and Resistance levels are the levels that serve as targets when buying or selling the pair. You can place Take Profit near these levels.
Red lines are channels or trend lines that display the current trend and show in which direction it is better to trade now.
The MACD indicator (14, 22, and 3) consists of a histogram and a signal line. When they cross, this is a signal to enter the market. It is recommended to use this indicator in combination with trend patterns (channels and trendlines).
Important announcements and economic reports that can be found on the economic calendar can seriously influence the trajectory of a currency pair. Therefore, at the time of their release, we recommend trading as carefully as possible or exiting the market in order to avoid sharp price fluctuations.
Beginners on Forex should remember that not every single trade has to be profitable. The development of a clear strategy and money management is the key to success in trading over a long period of time.
Relevance up to 02:00 2022-12-17 UTC+1 Company does not offer investment advice and the analysis performed does not guarantee results. The market analysis posted here is meant to increase your awareness, but not to give instructions to make a trade.
