Crypto Industry News:
According to CryptoQuant data published at the end of the year, the "supply in loss" is an indicator that measures the percentage of the total supply of bitcoin in circulation that is currently loss making.
The metric works with the chain history of each circulating coin to see what price it was last traded at. If that previous value of any coin was higher than the last BTC price, then that coin is currently losing money, which is taken into account by the indicator. The relevant indicator is "supply in profit", and its value can be derived from "supply in loss", subtracting it from 100.
The Bitcoin supply loss increased as the bear market extended. In the current BTC cycle, the market has peaked supply with a loss of around 55%, which is equivalent to most coins in circulation. The chart shows that the indicator also saw an uptrend as the 2018-2019 bear market continued and peaked above 60% when the BTC price also bottomed out.
Also in the COVID "black swan" crisis in 2020, the supply of losses reached high values and touched the same level of 60%. Of course, despite all the steep price drops (in particular, the collapse of LUNA, the bankruptcy of 3AC, and the recent FTX crash), the indicator ends 2022 without reaching such heights.
If the current cycle follows the same pattern making a bottom around 60%, then there is still some time to reach the indicator. And the only way an even greater supply would go into a loss state is if the price falls further. This means that 2023 will bring more problems for Bitcoin investors.
Technical Market Outlook:
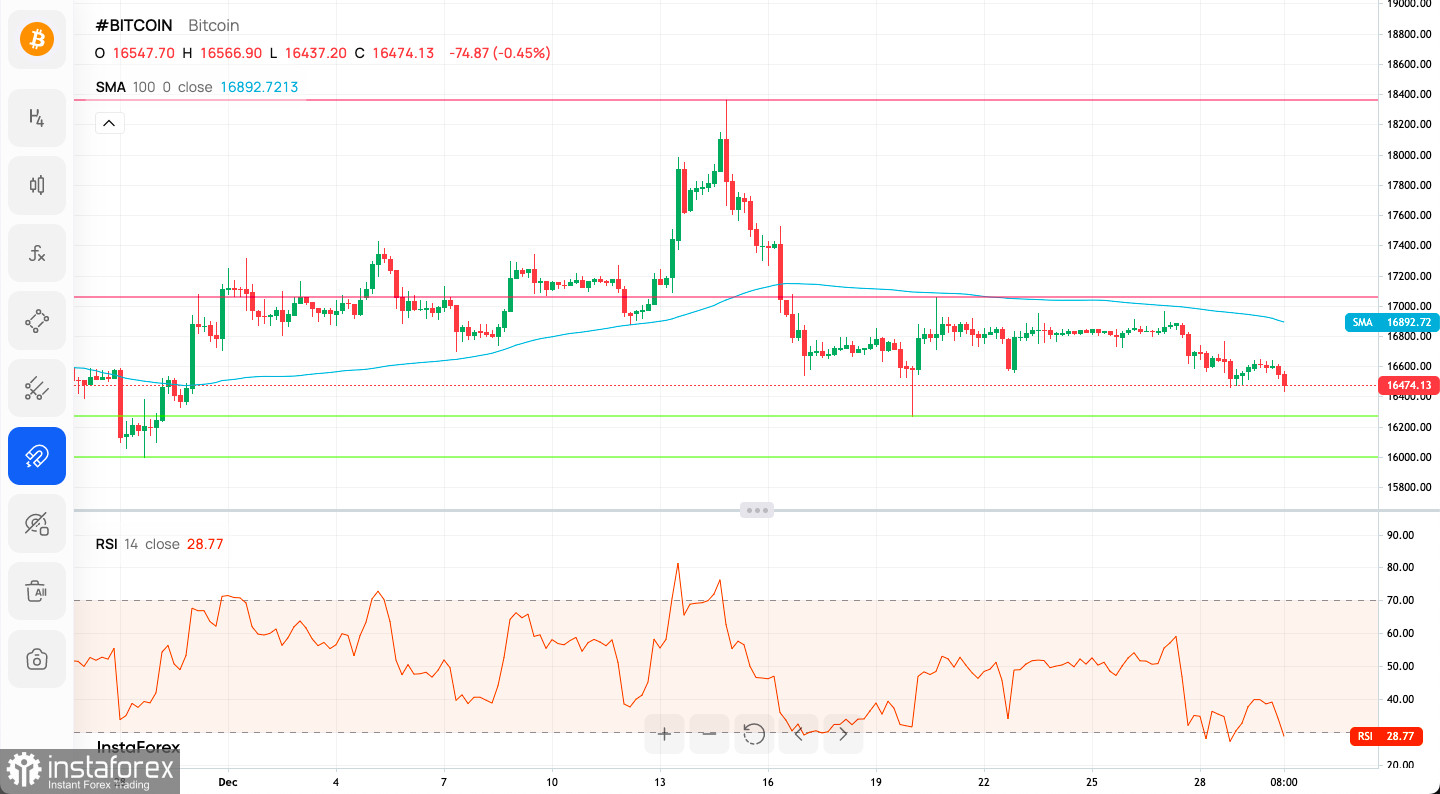
The BTC/USD pair had made a local high at the level of $17,055 in form of a Pin Bar candlestick pattern on H4 time frame chart and local low at the level of $16,271. The market keeps trading below 100 MA on the H4 time frame chart and is trading below the intraday technical resistance seen at $17,057. The volatility is still limited despite the recent spike down, so the trading rage is seen between the levels of $16,268 - $17,057. Any breakout below the range low would extend the corrective cycle towards the level of $15,984 (November 28th low).
Weekly Pivot Points:
WR3 - $17,153
WR2 - $16,998
WR1 - $16,916
Weekly Pivot - $16,845
WS1 - $16,746
WS2 - $16,688
WS3 - $16,533
Trading Outlook:
The down trend on the H4, Daily and Weekly time frames continues without any indication of a possible trend termination or reversal. So far every bounce and attempt to rally is being used to sell Bitcoin for a better price by the market participants, so the bearish pressure is still high. Moreover, there is a clear test of the 50 WMA located at the level of $15,600, so any breakout below the moving average and a weekly candle close below moving average will be considered as another indication of the down trend continuation. The new yearly low was made at $15,555 and if this level is violated, then the next long-term target for bulls is seen at $13,712. On the other hand, the gamechanging level for bulls is located at $25,367 and it must be clearly violated for a valid breakout in the longer term.
Relevance up to 09:00 2022-12-31 UTC+1 Company does not offer investment advice and the analysis performed does not guarantee results. The market analysis posted here is meant to increase your awareness, but not to give instructions to make a trade.